Use the Color tab of the Analysis Display Styles dialog to define value-color pairs that represent the ranges of analysis data.
- Manage tab
 Settings panelAdditional Settings drop-down
  (Analysis Display Styles)
With the exception of the Diagram with text option, which cannot display gradients, the Color tab is consistent across all styles.
| Name | Description |
|---|---|
|
Gradient |
Presents analysis results in a gradient color display from the maximum to minimum values. 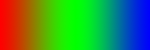 |
|
Ranges |
Presents analysis results in specific color ranges between the maximum to minimum values.  |
|
+ (Add rows above selected row) |
Adds value-color rows to the analysis display style above the selected row. Up to 10 values can be added at once. |
|
- (Remove selected row) |
Removes value-color rows from the analysis display style. |
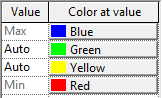
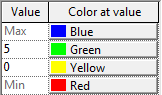
Value-Color Pairs
By default, there are Max (maximum) and Min (minimum) value-color pairs. These values are relative to the data displayed. You can only specify the colors for Min and Max values. These value-color pairs cannot be deleted.
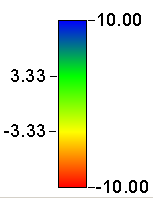
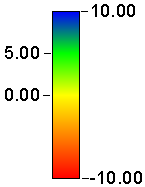
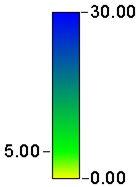
When you add a new value-color pair to the default maximum and minimum set, the color that is automatically assigned is midway (linearly in RGB) between the colors above and below it. The exact number corresponding to the Auto value varies according to the analysis results, as shown in the following table:
| Analysis Display Style | Analysis Results A min = -10; max = 10 |
Analysis Results B min = 0; max = 30 |
|---|---|---|
 |
 |
 |
As you add a new color to Ranges, the range is re-divided to accommodate the additional color for equal color distribution. The color that displays in the new row is the equivalent of the midpoint of the gradient between those 2 colors.
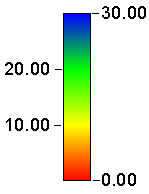
Click the Auto value field to specify a number. The color in the Color at value cell in the same row always corresponds to this number independently of the actual results, as shown in the following table:
| Analysis Display Style | Analysis Results A min = -10; max = 10 |
Analysis Results B min = 0; max = 30 |
|---|---|---|
 |
 |
 |
Click the Color at value field to specify a different color in a value-color pair.