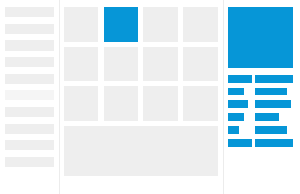
After Generative Design in Revit has finished creating a study, explore the outcomes to find the solution that best meets your needs.
The generative design process is iterative. You may want to create multiple studies using different methods and criteria to find the best solution to your design challenge.
 Video: Explore Outcomes of a
Generative Design Study
| To explore outcomes | |

|
1. Open the Explore Outcomes dialog.
|

|
2. In the left pane, select the study to explore. Tip: Use the Filter List by Study Type option to show studies of the desired type.
To export outcomes or delete the study, hover your cursor over a study and select the Options menu. |

|
3. To see details for an outcome, click its thumbnail.
|

|
4. To see charts that help you compare the outcomes, do the following:
For example, you can do the following:
|
Determine next steps:
- Explore more outcomes of the study. Examine their details.
- Export outcomes to manipulate the data and create different types of visualizations. Share the exported outcomes with others.
- Create a new study using different criteria: Click Create Study in the lower left part of the window.
- Integrate a selected outcome into your Revit model.

 Explore Outcomes.