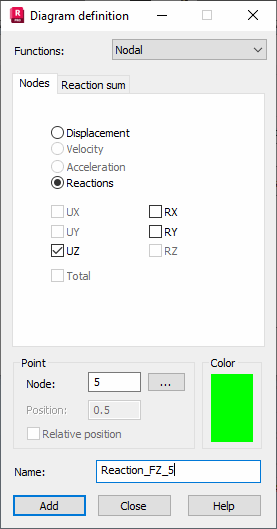
The Diagram definition dialog defines the diagrams of the quantities calculated during advanced analyses (non-linear, time history, and PushOver analyses). The dialog opens after clicking Add or Modify in the Advanced analysis dialog.

At the top of the dialog, the Functions selection list lets you select a type of a diagram being defined. Selecting 1 of the following functions changes the dialog contents.
- Nodal
- Bars - beams
- Bars - truss, cables: you can also select a function of an axial force in a bar
- Surface elements (shell, plate elements, plane deformation, and plane stress structure elements as well as axisymmetric elements)
- Solid elements
- Increment (time)
At the bottom of the dialog, you can assign a name of a defined function. The default name is generated automatically by Robot. The following are the component elements:
(value_name)_(option_name)_(number_of element_or_bar_or_node)/(position_on bar).
A node/bar/element is selected in the Point field. You can enter a number in the edit field.
For a single node / bar / element, 1 function is generated with a default name or a user-defined name.
When selecting nodes / bars / elements, 'n' functions are generated with a default name: (value_name)_(option_name). After the functions are added, in the Available functions panel of the Advanced analysis dialog, there displays 'n' functions with the following names:
(value_name)_(option_name)_(number_of element_or_node_or_bar_)/( position_on bar).