View and Interpret the Results
Helius PFA generates several state variable outputs available for viewing.
In this step, a key variable (SVAR1) is viewed and discussed. SVAR1 is the state variable that tracks fiber and matrix failure within an element.
After the solution has completed, click Main Menu > General Postproc.
To view the true deformation scale, click PlotCtrls > Style > Displacement Scaling. Select the 1.0 (true scale) radio button in the dialog box that appears and click OK.
State variable SVAR1 identifies the discrete damage state of the composite material. To plot this variable, use the PLESOL or PLNSOL commands. The PLESOL contour plot does not average values across element boundaries while the PLNSOL contour plot does average values across element boundaries. Since SVAR1 has discrete values, the PLESOL plot is the most useful. Note, to view SVARs greater than 11, power graphics must be turned off using the /GRAPHICS, FULL command.
To plot SVAR1 using a PLESOL contour plot, first enter SET, LAST into the command prompt, then enter PLESOL, SVAR, 1. The default plot will show the bottom section point of the bottom layer and the top section point of the top layer.
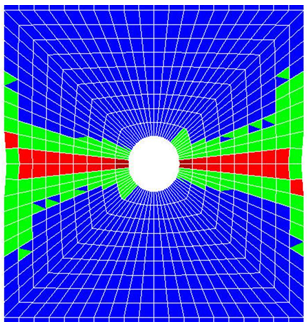
Since there are 3 possible values of SVAR1 for unidirectional Helius PFA materials, it is useful to adjust the contour color values. Click PlotCtrls > Style > Contours > Non-uniform Contours. In the dialog box that appears, set V1 = 1, V2 = 2, and V3 = 3 and click OK. The contour plot should be similar to the plot shown below. Minor differences are usually the result of mesh variations.
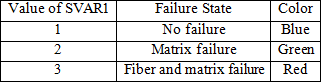
The following table lists the three possible values for SVAR1 and the corresponding failure states and contour colors.
To view results in a specific ply (or layer) of the composite plate, use the LAYER command.
Enter LAYER, 2 in the command prompt to view results in ply 2 (a 0° ply).
Note: It may be necessary to click Plot > Replot to refresh the Graphics Window. The contour plot of SDV1 for ply 2 at the end of the load step is shown below.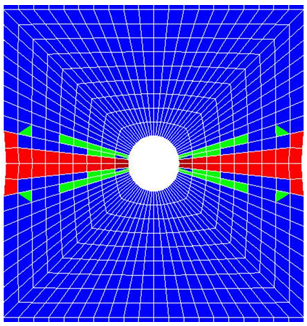
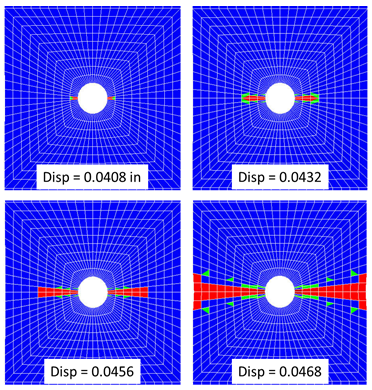
Viewing the progression of failure is often useful for visualizing the way a structure fails. Click Main Menu > General Postproc > Read Results or use the SET command to view results at specific points in time.
Starting at Substep 1, progress through the step while refreshing the Graphics Window to determine when failure initiates and how failure propagates in ply 2.
- Enter the command, SET, 1, substep#(30, 38, 40) or use Main Menu > General Postproc > Read Results > By Load Step (30, 38, 40). Refer to the video above to see how to perform this step.
The progression of failure in ply-2 is shown below. As expected, failure initiates at the corners of the notch and progresses laterally towards the edge of the plate until ultimate failure.