Generate a Load-Displacement Plot
Determine the global stiffness response of a structure using a load-displacement plot.
These plots are particularly useful for progressive failure analyses as they are a simple means of determining how the structure behaves as failure initiates and progresses.
Click Main Menu > TimeHist Postpro.
In the GUI that appears, click the Add Data icon (the green plus sign).
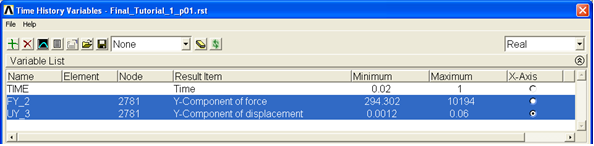
Select Reaction Forces > Structural forces > Y-Component of force. Click OK.
From the graphics window, select the node that had the specified displacement (refer to the image in the Define the Load section). Click OK.
Repeat steps 2-4, but instead, select Nodal Solution > DOF Solution > Y-Component of displacement.
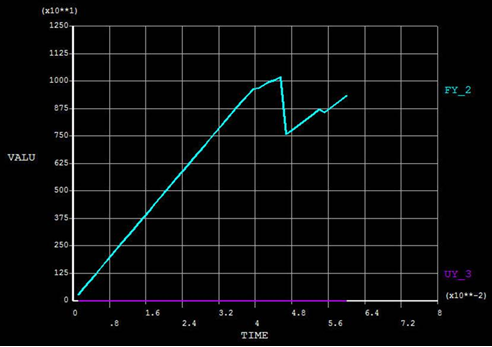
To plot the reaction force vs. displacement, set the X-Axis to UY_3, select FY_2 and UY_3, and click the Graph Data icon. Refer to the image below.
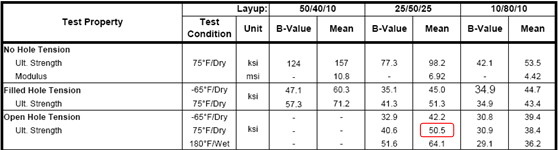
The load-displacement plot is shown below. The sharp drop in stiffness at a displacement of 0.0468 corresponds to ultimate failure of the plate. The simulated ultimate load is 10,180 lbs and the strength is 47.1 ksi. The experimental [1] strength of the plate is given in the table below as 50.5 ksi. The ultimate strength predicted by Helius PFA and the experimental strength differ by 6.7%.