After a simulation is run, the graphics window updates to display the results for the analysis type in the form of a volume plot (default display). The various results types populate the Results browser folder. To see the variety of results you can view, expand the Results folder.
| Simulation Type | Result displayed |
| Static Analysis | Displays the Displacement plot. |
| Modal Analysis | Displays the first frequency mode. |
To view a different result, right-click the browser node corresponding to the results you want to see and click Activate, or, double-click the result browser node. The graphics region updates to display the selected results type.
There are several display options available for interpreting the simulation results.
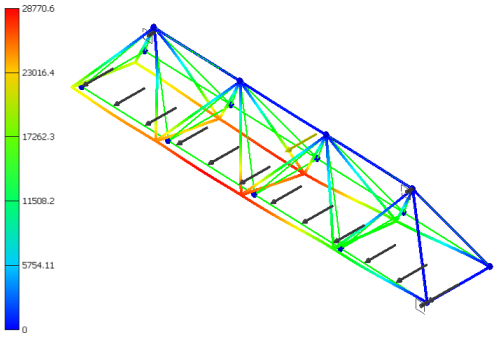
Volume Plots
The graphics region displays a volume plot and a color bar displays the range of the variable showing in the graphics window. Color order is as follows, from high values to low values: red, orange, yellow, green, cyan, and blue.
Smooth Shading
Smooth shading is the default plot presentation for all result types, whether Static or Modal analysis simulation. Colors blend from one to the next.
Contour Shading
The contour shading presents the colors using a strict bending method. Color separation is clearly seen.
To change the shaded display, select Smooth Shading, Contour Shading, and No Shading from the Display panel.
Deformation Plots
Most often, the true geometry deformation is slight in comparison to the overall model size. To understand where deformation is occurring an automated exaggeration effect is provided. The Adjust Displacement Display command provides the following display options:
- Undeformed
- Actual
- Adjusted x0.5
- Adjusted x1
- Adjusted x2
- Adjusted x5
When the volume plot is displayed, select one of the display options to exaggerate the deformation.
Animate Results
You can animate the simulation results and retain the animation for your records by producing video output.
Maximum and Minimum Results
Commands for easily locating the maximum and minimum result values are located in the Display panel.
Click the Maximum Value![]() command to display an annotation at the point where this condition occurs.
command to display an annotation at the point where this condition occurs.
Click the Minimum Value![]() command to display an annotation at the point where this condition occurs.
command to display an annotation at the point where this condition occurs.
Commands are available only after you run the simulation.
Boundary Conditions
The Boundary Conditions![]() command toggles the display of the load indicator which points to where the load is being applied.
command toggles the display of the load indicator which points to where the load is being applied.