When a simulation updates, the last active Result type is presented. You view the results of these calculations through the Results node in the browser.
There are the various result nodes within the Results browser node. You can view Forces, Moments, Normal Stresses, Shear Stresses, and Torsional Stresses results. For modal analysis, view results in the Modal Frequency folder.
When you activate a result in the browser the color maps on all beams is presented together with a color chart. The Color bar respects the settings of specified result type (quantity). Beams display at specified scale showing color charts per calculated results.
Additional commands for evaluating the results include:
- Minimum and maximum values that quickly show the locations of load extremes.
- A deformation scale that allows you to amplify the effects of loads so you can easily see the impact of loads.
- Volume plots, both smooth shaded and contour.
- Animation of the displacement.
- Display of beam local systems.
- Display of all load values.
There are three ways to view results on beams:
- Display the selected diagram in the graphics window.
- Open the Beam Detail dialog, and select the desired beam.
- Color bar displays results for beams.
Static Analysis
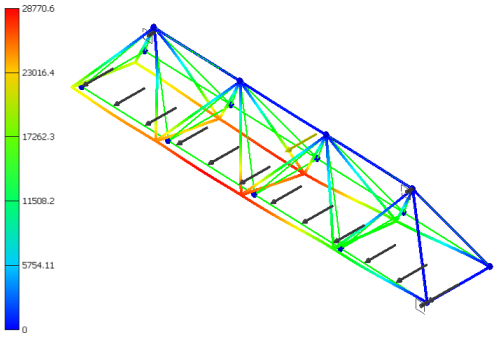
For static analysis, forces, moments, and stresses are calculated.
Normal stresses and two shear stresses define the stress state. Shear stresses are positive when their two defining positive axes rotate toward each other (using the right-hand rule).
Modal Analysis
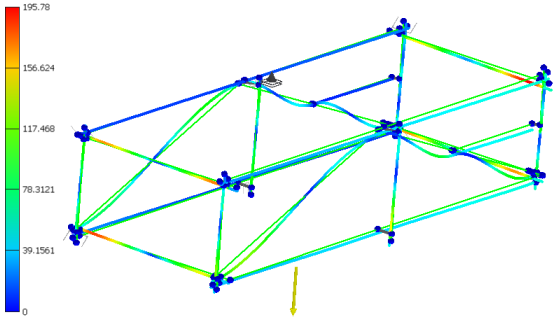
Creating a modal analysis provides the means to calculate the natural frequencies of vibration for the number of frequencies specified.
You can animate the deformed shape to show the modal shape associated with a particular frequency. The contours represent relative displacement of the part as it vibrates. Mode shape images are helpful in understanding how a frame assembly vibrates, but do not represent actual displacements. To find all the mode shapes below a given frequency, be sure to determine the next two or three mode shapes.