Modifying the diagrams

Select specific results types being presented as diagram. Run the simulation before you can view results displayed as diagrams for selected beams.
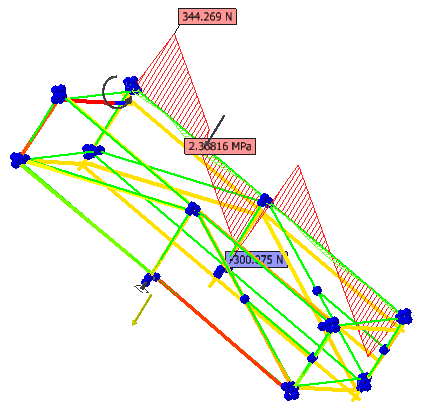
You can select an appropriate color for each of the results and differentiate positive and negative values in the Diagrams tab of Frame Analysis Settings.

Use the Diagram Scales dialog box to adjust the scale of displayed diagrams.

  1. In the ribbon bar, click Frame Analysis tab Result panel Diagram .
  2. In the Beams area, select to display diagrams for all beams, for a selected beam, or for all beams except selected ones. Select the beams you either want to display diagram, or beams where diagrams are not shown.
  3. Select specific results types being presented as diagram. Diagrams display in the graphics window.