- Display
- Shape Nodes, Hidden Nodes, Underworld Nodes
-
By default, the scene hierarchy does not display shape nodes, hidden nodes, or underworld nodes. It displays only transform nodes—nodes that hold attributes and other information on an object’s transformation and parent-child relationships.
Shape node—holds an object’s geometry attributes or attributes other than the object’s transform node attributes. A shape node is a child of a transform node. A transform node has only one shape node.
Hidden node—any object hidden using Display > Hide from Maya’s menu bar. The default cameras top, front, side, and persp are also hidden nodes.
Underworld node—a pair of nodes below a shape node. When you create a curve on a NURBS surface, Maya generates an underworld transform node and shape node below the shape node of the surface. The CV positions of underworld nodes have UV coordinates on the surface rather than coordinates in world or local space.
A dotted line in the scene hierarchy indicates a connection to an underworld node. Connections to instanced objects are also indicated by dotted lines.
Note:Hypergraph option settings are saved with a scene file. The options are not saved for Maya globally.
Example 1
If you select Create > NURBS Primitives > Sphere to create a sphere, Maya creates a transform node and a shape node.
The sphere’s shape node holds the mathematical description of the sphere’s shape. The sphere’s transform node holds the sphere’s position, scaling, rotation, and so on. The shape node is the child of the transform node.
If you select Options > Display > Shape Nodes in the Hypergraph, the scene hierarchy shows these nodes for the sphere:
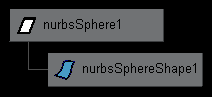
Maya gives the nodes the default names shown in the preceding figure. The transform node is nurbsSphere1, the shape node is nurbsSphereShape1. If you rename the transform node, for example, to Bubble, Maya renames the shape node to BubbleShape.
If you rename the shape node, Maya does not rename the transform node. Maya doesn’t transmit a child’s attribute changes up to its parent.
Example 2
If you select Create > NURBS Primitives > Sphere to create a sphere, Maya creates a transform node and a sphere node. If you then select Modify > Make Live, then use the Create > Curve Tools > CV Curve Tool to draw a curve on the surface of the sphere and turn on the display of shape nodes and underworld nodes, the scene hierarchy appears as follows:
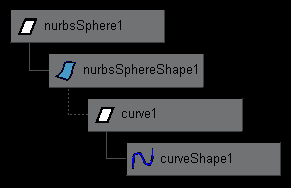
Maya gives the nodes the default names shown. The transform node is nurbsSphere1, the shape node is nurbsSphereShape1. The curve1 and curveShape1 nodes are underworld nodes for the curve created on the sphere’s surface.
When a curve-on-surface is hard to select in the workspace because of crowding or complex geometry, you can select it easily in the scene hierarchy with underworld nodes displayed.
- Expression Connections
-
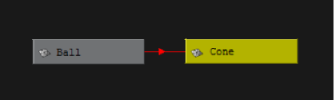
When enabled, displays a red line between two nodes that are connected by an expression. An arrow indicates the direction of the connection.
 Tip:
Tip:You can change the color-coding of the connection lines by selecting Color Settings and expanding Hypergraph/Hypershade.
- Constraint Connections
-
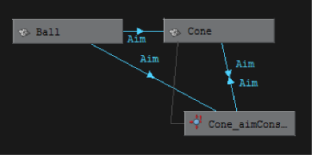
When enabled, displays a blue line between two nodes that are connected by a constraint. An arrow indicates the direction of the connection.
Tip:Select Toggle Connection Label in the Hypergraph marking menu to show the type of constraint above each connection line. See Show connections in the Hypergraph.
 Tip: You can change the color-coding of the connection lines by selecting Color Settings and expanding Hypergraph/Hypershade.
 - Deformer Connections
-
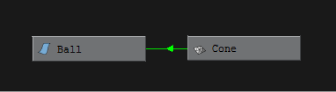
When enabled, displays a green line between two nodes that are connected by a constraint. An arrow indicates the direction of the connection.
- Show Cached Connections
-
Shows any connections that are cached.
- Filter Connections
-
Lets you filter expression, constraint, and deformer connections in the Hypergraph. The following options are also available in the Hypergraph marking menu (Shift + right-click).Note: Expression Connections, Constraint Connections and/or Deformer Connections must be enabled to view connections.
- Show All Connections
-
Show the connections to and from every node in the scene hierarchy.
- Show Connections to/from Selected
-
Shows the connections to and from the selected node.
- Show Connection to Selected
-
Shows the connections leading up to the selected node.
- Show Connection from Selected
-
Shows the connections leading from the selected node.
- Graph Layout Style
-
The Graph Layout Style lets you rearrange the layout style of nodes to suit your needs. This option is only available in the Connection View. Rearranging the layout can make the connections and their relationships more meaningful.
- Circular Layout
-
Displays the Hypergraph connections in a circular fashion by placing nodes in circular cluster arrangements.
- Hierarchical Layout
-
Displays precedence relationships in the graph by placing nodes at different levels.
- Orthogonal Layout
-
Aligns nodes within the graph vertically and horizontally.
- Symmetric Layout
-
Displays the Hypergraph nodes symmetrically when the topology of the nodes allows for it.
- Tree Layout
-
Displays the Hypergraph hierarchy as parent/child relationships with the root nodes at the top and child nodes further down the hierarchy.
- Orientation
-
Select one of the following orientation options.
- Horizontal
-
Display the Hypergraph hierarchy horizontally.
- Vertical
-
Display the Hypergraph hierarchy in a vertical arrangement.
- Schematic
-
Display the Hypergraph hierarchy in a schematic arrangement where nodes are spaced evenly apart and children appear under their respective parents.
- Layout
-
Select one of the following layouts.
- Freeform Layout
-
Place nodes or groups of nodes in any location without conforming to structured hierarchy layouts.
- Automatic Layout
-
Automatically groups the nodes into default hierarchies.
- Transitions > Animate Transitions, 5/10/15/20 frames
-
By default, Maya dollies from one view to another instantaneously when you change the panel view of a graph. (For example, by selecting View > Previous View.) You can slow Maya’s transition speed between views to make the view change action easier to see.
20 Frames dollies slowest, 5 Frames dollies fastest.
- Update > On Nodes Creation, On Selection
-
The Hypergraph automatically updates the scene hierarchy when you add or delete an object, rendering node, or other item in the scene
When you select an object in the scene hierarchy or dependency graph, the object is also selected in the workspace, Outliner, and elsewhere in Maya. Also, when you select an object in the workspace, Outliner, and elsewhere in Maya, the object becomes selected in the scene hierarchy or dependency graph.
These updates slow Maya operation when you work with a complex scene or when you’re examining nodes or dragging nodes to new positions in a free-form hierarchy. You can turn off the updating option to improve operation speed.
- Node Display Override Color
-
Display layer colors on the nodes. Coloring the nodes helps you organize and distinguish the nodes in their respective layers.
- Show Cached Connections
-
Shows any connections that are cached.
- Heat Map Display
-
Colors nodes in the Hypergraph based on their timed performance. Nodes with a 0 timing value appear grey, while nodes with a positive timing value are displayed in increasing shades from blue to red.
While you can set Heat Map Display on or off for individual Hypergraph windows, all Hypergraph windows are subject to the same set of Heat Map Display options.
For more information about the Heat Map Display, see "Performance monitoring with the Heat Map Display" in Hypergraph tips.
- Metric
-
Determines timing metric for the nodes.
- Type
-
Determines the timing type.
- Threshold
-
Determines how custom thresholds affect the Heat Map Display.
Remap colors adjusts the color scheme relative to the current threshold instead of the highest/lowest timing value node.
Hide nodes automatically hides all nodes whose timing values are higher or lower than the Upper threshold and Lower threshold respectively.
- Upper threshold / Lower threshold
-
Lets you set a custom boundary for the upper (red) and lower (blue) thresholds of the Heat Map Display.
- Selection cutoff
-
Allows you to add nodes over the cutoff value relative to the threshold measured in percentage.
- Timing
-
Turns global node timing on and off.
- Reset timers
-
Reset all node timers to 0.
- Redraw HyperGraph(s)
-
Regenerates and redraws all Hypergraph windows currently with Heat Map Display mode enabled.
- Show Relationship Connections
-
Shows connections that do not represent data flow.
- Merge Connections
-
Displays multiple connections between two nodes as a single, bold line. For more information, see "Merge connections" in Hypergraph tips.
- Opaque Assets
-
Displays expanded assets nodes with an opaque background.