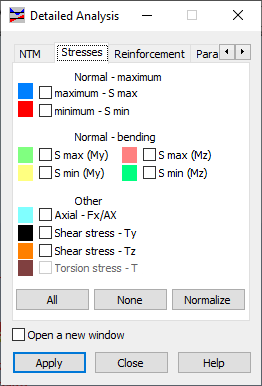
Select Detailed analysis to select quantities for bars selected from a structure, as well as to determine the parameters of results presentation.
The Detailed Analysis dialog consists of five tabs.
- NTM
- Stresses
- Reinforcement
- Parameters
- Division points.
NTM, Stresses and Reinforcement select the quantities for the bars selected from a structure. The values of the selected quantities (displacements, internal forces, stresses, theoretical (required) or real (provided) values of reinforcement area or reinforcement ratio) will be presented graphically. They are visible in the viewer and the table. You can indicate several quantities to be presented simultaneously for the bars selected from a structure.
The NTM tab presents reactions of an elastic ground for bars (the options KY and KZ). The KY and KZ values are obtained as elastic ground reactions (R = K u, where R denotes force of reaction, K coefficient of elastic ground reaction, u displacement) along the bar length in the local system if elastic ground has been defined for the bar.
See also:

|

|
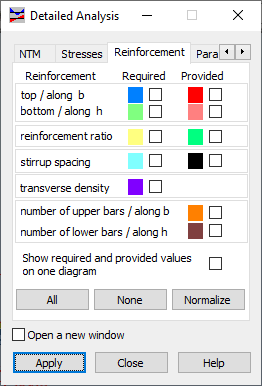
The Reinforcement tab of the Detailed Analysis dialog quantifies reinforcement for presentation.

- Theoretical (required) reinforcement - top reinforcement (along the side of b length), bottom reinforcement (along the side of h length).
- Real (provided) reinforcement - top reinforcement (along the side of b length), bottom reinforcement (along the side of h length).
- Theoretical (required) and real (provided) reinforcement ratio.
- Theoretical (required) and real (provided) stirrup spacing (for transversal reinforcement).
- Transverse density - the ratio of transversal reinforcement area to the unit of length of an RC element.
- Number to top bars (top reinforcement) along the side of b length.
- Number to top bars (bottom reinforcement) along the side of h length.
- Show theoretical (required) and real (provided) values on one diagram option. If enabled, one diagram for one quantity will show theoretical (required) and real (provided) values. If the option is disabled, all the values are presented on separate diagrams.
The remaining tabs in the Detailed Analysis dialog determines the method selected quantities are to be presented in the respective diagram and table. The Parameters tab controls diagram presentation on the graphical viewer. The Division points tab indicates the intermediate points for which the values of selected quantities are to be presented in the table.

|

|
Options in the Parameters tab include the following.
- The Diagram Description field decides how the value descriptions will be presented in a diagram.
- None - Descriptions in diagrams of the quantities available in the Detailed Analysis dialog box will not be presented.
- Labels - Descriptions in diagrams of the quantities available in the Detailed Analysis dialog box will be presented as labels showing values at selected points on bars. Labels are slightly shifted away from diagrams.
- Text - Descriptions in diagrams of the quantities available in the Detailed Analysis dialog box will be presented as values at the selected points on bars. Descriptions are positioned perpendicular to the bar.
- The Values selection field is available to the Labels and Text options. Values limit the number of diagram descriptions displayed in the viewer. The following options are available:
- All - Diagram descriptions are displayed for each calculation element at its beginning and end as well as at the points of the maximum and the minimum values.
- Local extremes - Diagram descriptions are displayed only for the maximum and the minimum values on a bar. This is particularly useful when bars are divided into a great number of calculation elements, and only the extreme values on the whole bar are of interest, not the intermediate values,
- Global extremes - Descriptions are displayed only for the global maximum and minimum values, thus presenting extreme values for the whole structure.
- The Positive and Negative Values field determines if positive and negative values should be differentiated by means of colors in diagrams
- The Filling field determines the filling of a diagram (either fence or filled).
Options in the Division points tab include the following.
- You can indicate the points for which the values of relevant quantities will be presented in the table.
- If N points along bar length is selected, the number of points (the beginning and end node of the bar included) are defined and distributed along the length of the bar for which the relevant values are presented. The default value of N = 2. The table will present the values of the quantities selected for presentation only for the bar beginning and end. If N = 3, then a point will be added in the exact middle of the bar and the values of relevant quantities for the point will be presented.
- If the
Characteristic option is checked, the user defined point on the selected bar (its absolute or relative distance to the bar beginning) for which the values of the relevant quantities are displayed. The successive points selected for presentation will be accompanied by the following descriptions.
- Auto - Points generated automatically
- Defin. - User defined points
- Zero - Characteristic points on the bar (where the value of the selected quantity equals zero and the extremes of the selected quantity).
- Refresh button - Refreshes the list of points (if changed by the user) for which the values of indicated quantities are to be presented.
- Delete button - Deletes points on a bar for which the values of indicated quantities are no longer to be presented.
- Add button - Adds points on a bar for which the values of indicated quantities are to be presented.
- If Open a new window option is selected, a new window for the diagrams of quantities indicated in the Detailed analysis dialog will open.