Decision Center: Iso Surface Summary Image
In the previous step, we looked at the temperature through the middle of the hall, and saw some pretty significant differences between the Summer and Winter scenarios. In this step, we'll use the iso surface summary image to better understand the interaction between the flow and temperature.
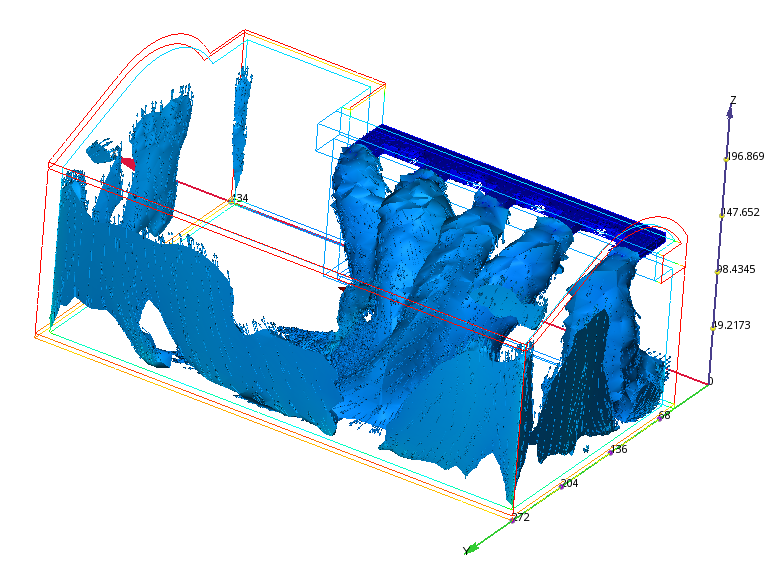
Note: For reference, this is the iso-surface (of constant velocity = 28 ft/min, colored by temperature) from the Summer scenario:
1. In the Decision Center, left click on Temperature-Flow Iso Surface.
2. Compare the results by clicking the Play button.
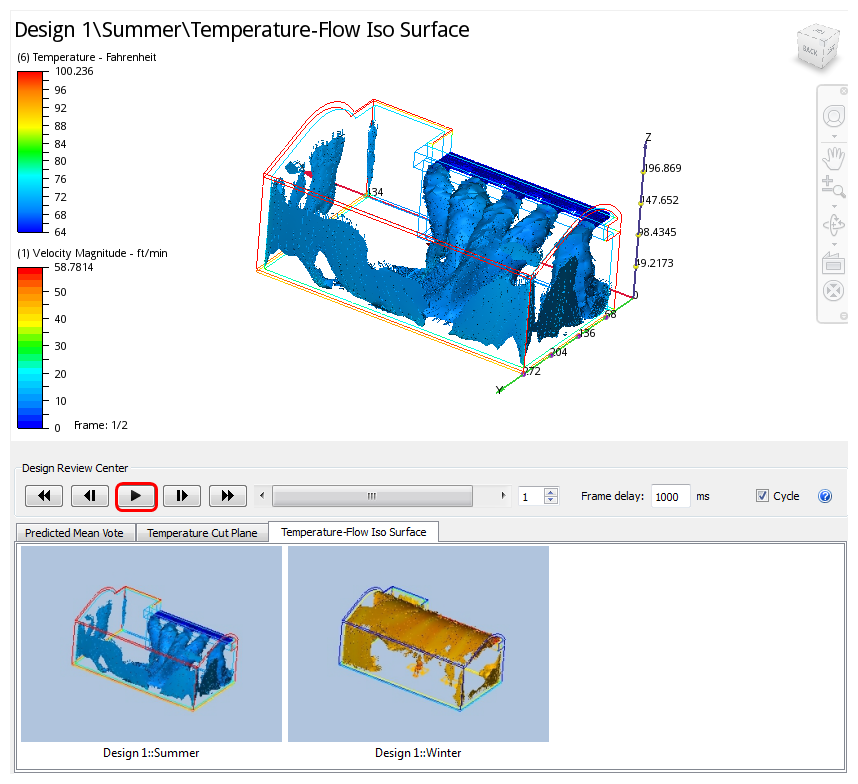
3. While the images are playing, rotate the model to view the hall from different angles.
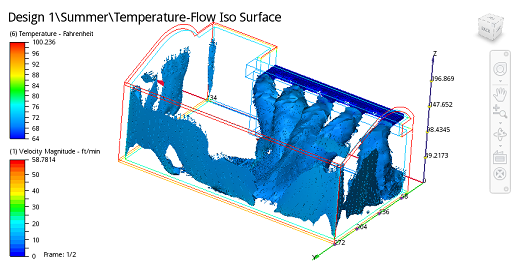 | 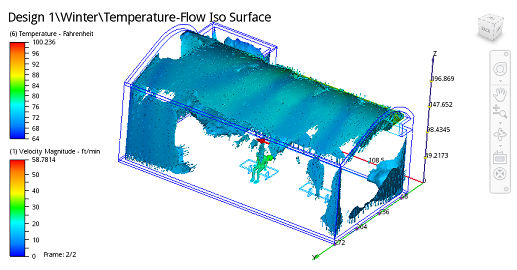 |
Note: This image shows the temperature everywhere in the model that has a velocity of 28 ft/min. These images show how the cooled supply air practically impinges on the occupant in the Summer scenario and how the warm supply air circulates throughout the hall, providing a less intrusive warm air flow.
In the next step, we'll look at some quantitative results...