Cavitation
Cavitation is a physical phenomenon that occurs in many high-velocity liquid flows. When the liquid pressure falls below the vapor pressure, vapor bubbles form in the liquid. Cavitation is commonly found in high-performance valves, flow control devices, and pumps, and can greatly reduce the efficiency of these devices. Prolonged cavitation leads to pitting and erosion of the device, resulting in costly downtime and repairs.
The cavitation model tracks the vapor bubble volume fraction and predicts the onset and location of bubble formation within the flow. It is best suited for predicting small regions of cavitation, and does not predict large vapor formations. This cavitation model assumes a collection of bubbles and not a total vapor region.
When cavitation is enabled, the fluid pressure does not fall below the vapor pressure. (If cavitation is disabled, the pressure is allowed to fall below the physical limit.) This improves the accuracy of forces computed by the Wall Calculator when cavitation is present.
Usage
To simulate cavitation of a liquid:
- Assign the liquid material phase to the flow parts.
- Focus the mesh in regions where cavitation is expected. Mesh Refinement Regions are useful for this.
- To enable cavitation, open the Solve quick edit dialog, select the Physics tab, and click Advanced. Select Cavitation.
- If the flow is subject to temperature variations, note that the liquid material can vary with temperature (buoyancy), but the vapor pressure of the vapor state is held constant.
To define the vapor properties of a cavitating liquid:
Open the liquid material in the Material Editor, and click the Phase button.
The two variation methods are Vapor Pressure and Linked Vapor Material.
Choose Vapor Pressure to specify the vapor pressure of the liquid (when it is in a vapor state).
- Most of the liquids in the Default material database have a vapor pressure saved as part of the material definition. This field is automatically populated if a vapor pressure value is stored.
- Use this option if you know the vapor pressure, but do not have the vapor properties defined in a separate material.
- This can also be used to specify the clipping pressure of a liquid, even if cavitation is not being solved for. This is the minimum pressure that can physically occur in the liquid. Any computed values of pressure that are below this value are reset to this value.
Choose Linked Vapor Material to associate a vapor material with the selected liquid material.
- Use this option if you have the vapor properties defined in a separate material.
- To use this, select the vapor material from the menu. Only materials in the same material database can be used. (The linked vapor material must be in the same material database as the liquid phase of the material.)
- A vapor material that is linked to a liquid material cannot be deleted from the database until the link is removed from the liquid material definition.
Visualization
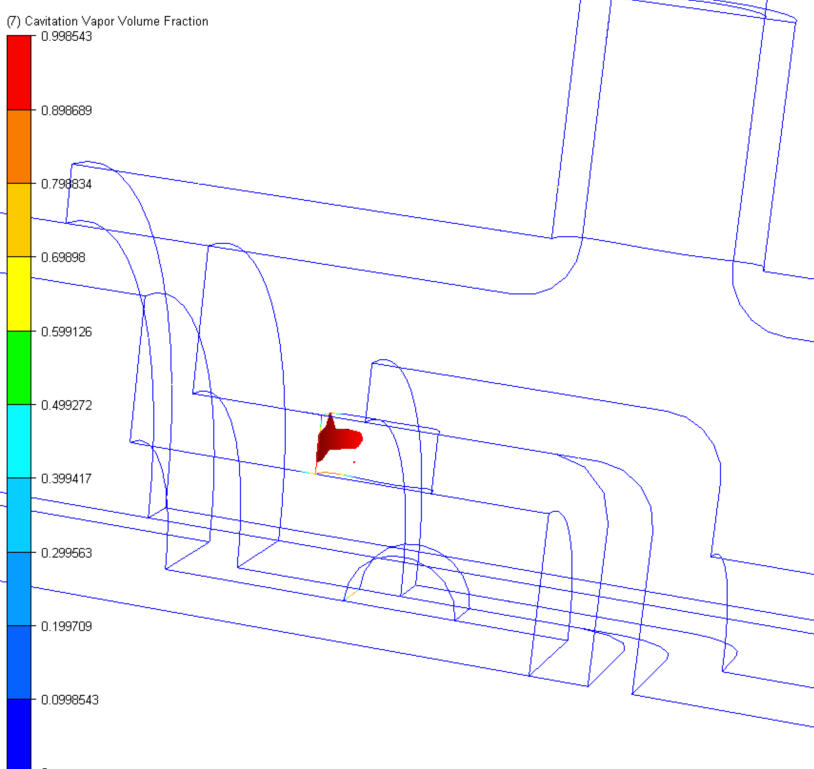
After the analysis is finished running, visualize regions that are cavitating by plotting the Cavitation Vapor Volume Fraction. This quantity is a fraction, and varies from 0 to 1, with a value of 1 indicating 100% vapor bubbles. The most convenient way to visualize the location of cavitation is with an iso-surface. Setting the value to 1 (or close) will plot a three-dimensional view of the cavitating region:

Related Topics: