Visualize the Flow
In this step, we use a results plane to view the flow through the valve.
Click Planes from the Results tab:

To create a Plane, click Add on the Planes context panel:

You should see this:
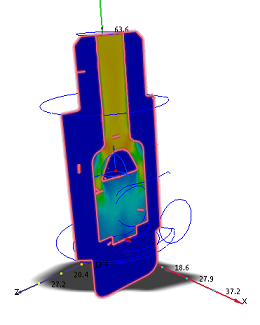
To rotate the plane, left click on it, and click Z from the Context dialog:
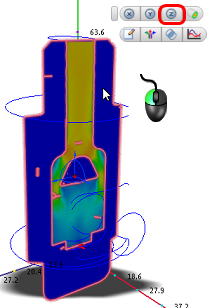
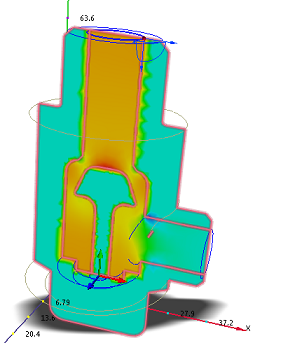
You should see this (but without the letters):
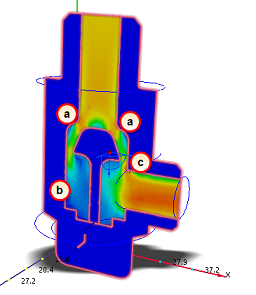
What is this image telling you?
- The orange regions near the top of the poppet mean that the flow is accelerating through the gap.
- The flow on the trailing side of the poppet seems to be recirculating. We'll be able to tell more when we look at vectors.
- As the flow turns toward the outlet, it accelerates off the inside corner.
To see the pressure drop through the valve, right click on the plane, click Plane result and Static Pressure:
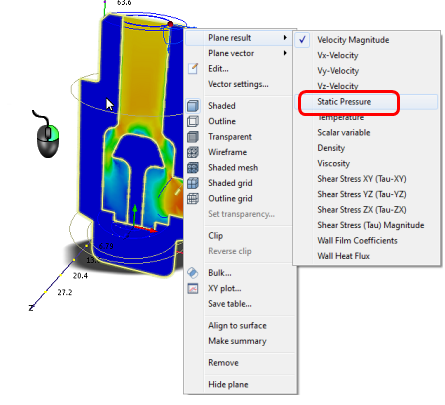
You should see this:
This plot shows the pressure drop through the valve. Because the pressure is 0 at the outlet, the pressure at the inlet is the overall pressure drop. Note that the pressure dips pretty low as it turns the inside corner near the outlet (position "C" from step 3). Fortunately it's not so low that cavitation is an issue.
In the next step, we use vectors to better understand the flow.