To adjust Traverse Data
-
Click Home tab
 Create Ground Data panel
Traverse Menu
Traverse Adjustment
Find.
Create Ground Data panel
Traverse Menu
Traverse Adjustment
Find.
The Traverse Adjustment dialog box is displayed.
- Use the Traverse Source option to select the TRV2 file to open.
Note: The Traverse Adjustment dialogue box is automatically opened and populated with the current TRV2 file when you use the Load Balance Tool option from the Traverse Editor.
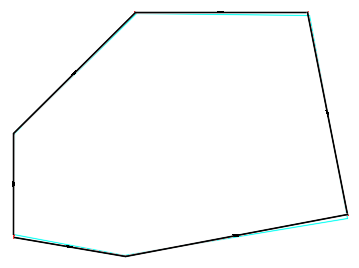
When the TRV2 file is opened in the dialogue box, the default adjustment method graphics are displayed in the drawing. For example, the following illustration shows a traverse with the default colour for the Compass Adjustment Type (blue) applied:
- If you want to limit the adjustment to a portion of the traverse, you can specify a different Start Point and / or End Point.
- If the traverse is open, specify the Point of Closure to use. By default, the Point of Closure defaults to the same point as the Start Point regardless of whether the traverse is open or closed.
- To apply angular adjustments, select the Angular Balance check box and then specify a Observed Direction and a Closure Direction if the traverse is an open traverse.
- Click settings to open the COGO adjustment Settings dialogue box where you can do the following:
- Limit the data to one or more adjustment types.
- Specify the row colours to use.
- Specify how curve data is treated.
Note: Curves themselves cannot be adjusted, so line segments are added into the traverse at either the chords or the IPs to represent the curve. These line segments become new sides for the traverse and the curves are removed. After adjusting the traverse, you can add curves back into the traverse by using AutoCAD drafting tools such as the ARC, FILLET and FITCURVEFEATURE commands.
- Review the closure summary data and data for each side.
- If more than one method is currently displayed in the dialogue box, select the type of adjustment to apply from the Adjustment to Apply list and then click Apply Adjustment.
This adds a polyline and COGO points to the drawing to represent the adjusted data.
You are also prompted to save the adjusted data to a new TRV2 file. By default, the original name of the TRV2 file is used, appended with the name of the adjustment method that is applied.
To output a Traverse Adjustment Report
You can output a report for the currently selected adjustment method, or for all available adjustment methods. Use the Report Settings, available from the Toolbox tab of the Toolspace, to specify the Client and Prepared by information that is in the report header.
- Click or View tab
 .
.
- On the Toolbox tab, click Edit Report Settings.
- In the Edit Report Settings dialogue box, expand the tree view and edit the values in the Value column.
The following settings are used in the Traverse Adjustment Report:
- Client Contact Name
- Client Company Name
- Client Address1
- Owner Preparer Name
- Owner Preparer Company Name
- Owner Address1
- Click OK.
- In the Traverse Adjustment dialogue box, click Generate Report, then select one of the following options:
- Current Adjustment to Apply: Outputs a report for the method selected in the Adjustment to Apply list.
- All Displayed Adjustment Methods: Outputs a report for each method displayed in the Traverse Adjustment dialogue box.
- In the Generate Report dialogue box, specify the location and the name for the report.
- From the Save as Type list, select either HTML, or PDF files and then click Save.
Tip: The report includes a graphic which depicts the adjusted traverse. The graphic for the HTML reports is named<Report name>.bmp and is saved to the same location as the .html file. This graphic is referenced into the .html file, so when you are archiving or sharing an HTML report, include both the .html file and the .bmp file.