To further refine this process, a standard error ellipse can also be drawn. Using an F distribution from applied statistics, either a 95% or 99% probability error ellipse is created. This ellipse has arcs straight to the sides of the error rectangle, with its orientation determined by an angle, t, and auxiliary orthogonal u-v axes. Again, values from the covariance matrix are used to calculate the t angle and the associated semi-major and semi-minor axes.
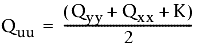
First solve three variables to use in equations that determine the semi-major and semi-minor axes: K, Quu and Qvv.
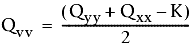
The following formulas are used:
and
where
- Qxx, Qyy, and Qxy are values from the covariance matrix.
Then, these values are used to solve two equations to determine Su, the semi-major axis length and Sv, the semi-minor axis length:
and
where
- So = standard deviation of unit weight
Finally, the angle t, which the u axis makes with the Y axis, is solved for by the following equation:
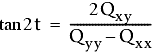
The adjusted point is most likely found within this ellipse with either a 95% or 99% degree of confidence.