Use the Plot Layout Tools toolbar to create plots by subdividing existing plots.
When you add a new plot line to an existing plot, you can specify the size of the new plot and the method with which to move the plot line. You can insert a new free-form plot line or choose one of the following types that move across the plot in a controlled manner:
- Slide Line. Holds either a fixed angle to the frontage or an absolute direction.
- Swing Line. Fixed at one end and swings across the plot frontage
When creating or editing plots with the Plot Layout Tools, preview graphics display the proposed solution which results from the specified layout parameters used to define plot components such as minimum plot frontage, width, and depth. As you use the tools to determine the design of proposed new plots, these graphics display to illustrate the proposed solution, and you are prompted to either accept or reject the solution. When you modify the layout parameters, the graphics update dynamically while the Plot Layout Tools toolbar is open and the parameters are being edited.
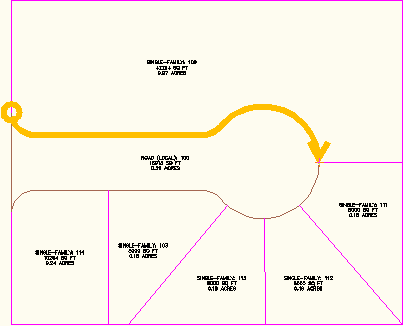
Proposed frontage is highlighted.
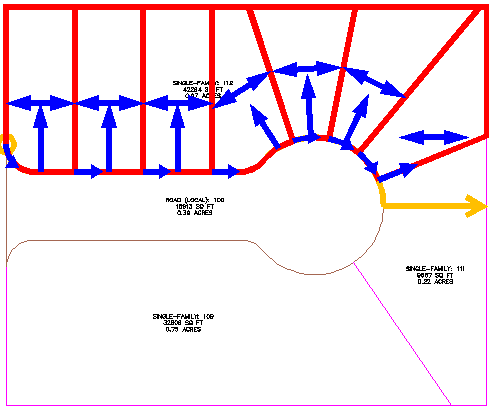
Preview graphics display proposed layout solution based on plot sizing parameter values.
![]() Tutorial Exercise: Subdividing a Plot with a Free-Form Segment
Tutorial Exercise: Subdividing a Plot with a Free-Form Segment