Use this toolbar to access tools for working with plot segments and setting parameters for plot size.
-
 Create Plot
-
Opens the Create Plots - Layout Dialog Box where you can change default plot settings during a layout session.
Plot Line Tools
-
 Add Fixed Line - Two Points
-
Draws a plot line as a line segment. Click a starting point and an endpoint in the drawing.
-
 Add Fixed Curve - Three Points
-
Draws a plot line as a curve segment. Define a starting point, pass-through point, and endpoint.
-
 Add Fixed Curve - Two Points And Radius
-
Draws a plot line as a curve segment. Define a starting point, radius value, curve direction, and endpoint.
-
 Draw Straight-Straight With No Curves
-
Draws a connected series of plot line segments. Click a sequence of points.
Plot Sizing Tools
These tools precisely control the position of individual plot lines while respecting user-defined parameters. The Plot Sizing Tools create or edit attached plot lines.
Use either the Slide Line Create or Swing Line Create command in automatic mode to create a series of evenly sized adjacent plots. For manual layout, specify the new location for a plot line by picking a point or dragging the line using OSNAP.
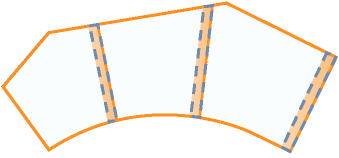
When Plot Sizing parameters or Automatic Layout options are selected or specified, a corresponding preview graphic displays at the bottom of the Plot Layout Tools dialog box.
-
 Slide Line - Create
-
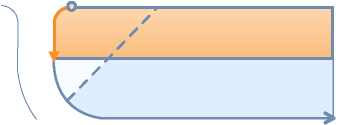
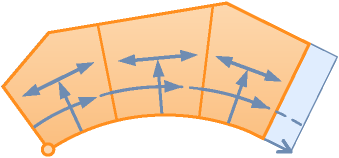
Creates one or more new plot lines that you define with start and end points along the frontage, and optionally, an angle relative to the frontage or an absolute direction for the plot line. Relative angles are measured in + degrees, from 0 (toward the endpoint) through 180 (toward the start point). Note that 90 degrees is perpendicular/radial to the frontage definition. Define the direction by means of whole circle bearing, quadrant bearing, or two points in the drawing.
-
 Slide Line - Edit
-
Moves a plot line. You can retain or change the line’s frontage angle or absolute direction.
-
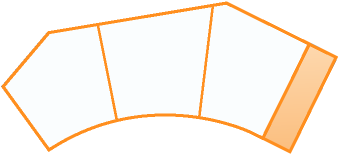
 Swing Line - Create
-
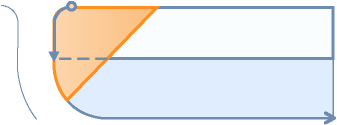
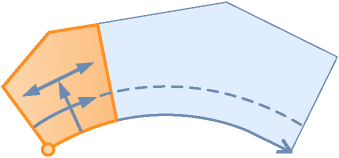
Creates a plot line defined with start and end points along the frontage and a fixed swing point on the opposite side of the plot. Adjust the size of the plot by swinging the plot line to intersect a different point along the frontage, subject to a minimum area and frontage limit.
-
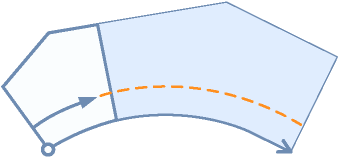
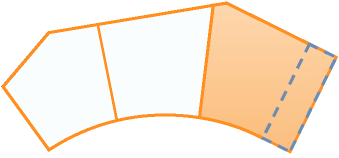
 Swing Line - Edit
-
Moves a plot line by swinging it from one end. Select which end to use as the swing point.
-
 Free Form Create
-
Creates a new plot line. Define an attachment point and a quadrant bearing, whole circle bearing, or second attachment point.
IP Editing Tools
-
 Insert IP
-
Inserts a vertex at the point you click on a plot segment.
-
 Delete IP
-
Deletes a vertex that you select on a plot segment, and redraws the plot line between the vertices on either side.
-
 Break Apart an IP
-
Separates end points at the vertex you select. Specify a separation distance.
Note: Breaking an IP does not delete or merge plots, as deleting segments does. It merely makes plots incomplete. Affected segments revert to geometry elements, and plot labels disappear. Geometry elements become plots again if you reconnect loose vertices to make closed figures.
Other Tools
-
 Delete Sub-Element
-
Deletes a plot sub-element, such as a plot line or curve. If you delete a sub-element that is not shared by another plot, the entire plot is deleted. If you delete a shared sub-element, the two plots that shared it are merged.
-
 Plot Union
-
Joins two adjacent plots. The first plot you select determines the identity and properties of the joined plot.
-
 Dissolve Plot Union
-
Restores the separate identity of joined plots.
-
 Pick Sub-element
-
Selects a plot sub-element for display in the Plot Layout Parameters dialog box. Click Sub-element Editor before you click this button.
-
 Sub-Element Editor
-
Opens the Plot Layout Parameters Dialog Box where you can review or edit attributes of the selected plot subentity.
-
 Undo
Undo
-
Cancels the previous command.
-
 Redo
Redo
-
Repeats the cancelled command.
-
 Expand the Toolbar
 -
Opens a property sheet where you can change parameters for new plot sizing, automatic layout, and manual layout.
Plot Sizing Parameters
When a plot sizing parameter is selected, a graphic displays to illustrate how the parameter affects the result of the current plot sizing command.
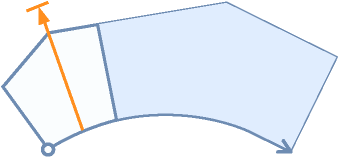
- Minimum Area
-
Specifies the minimum area criteria for new plots. This value can be changed at anytime during the current command and must be greater than zero.
Note: If the minimum frontage criteria is met, but the minimum area has not, the plot frontage will be increased until the minimum area is obtained.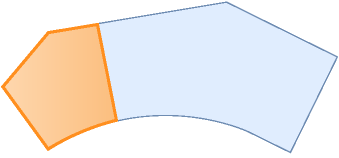
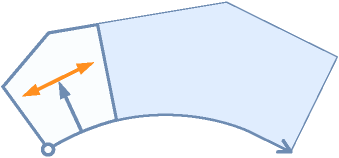
- Minimum Frontage
-
Specifies the minimum frontage criteria for new plots.
Note: If the minimum area criteria is met, but the minimum frontage has not, the plot area will be increased until the minimum frontage is obtained.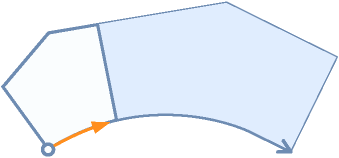
- Use Minimum Frontage At Offset
-
Enables/disables the use of the minimum frontage at offset during the plot sizing commands. This value can be changed at anytime during the current command.
- Frontage Offset
-
Specifies the default value for the frontage offset.
- Minimum Width
-
Sets the default value for Minimum width. This value must be greater than or equal to zero.
- Minimum Depth
-
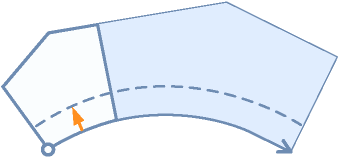
Specifies the minimum depth criteria used to size new or edit existing plots. The minimum depth starts at the mid-point of the resulting frontage of the new or edited plot and is oriented normal (perpendicular) to the intersected frontage segment.
Note: If the minimum area and frontage criteria are met, but not the minimum depth, the frontage and area are increased until the minimum depth is obtained. If no solution is found, a command prompt displays.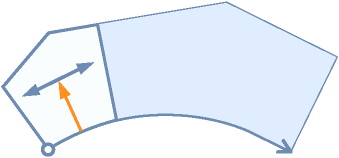
- Use Maximum Depth
-
Specifies whether the maximum depth criteria is used when creating or editing plots.
- Maximum Depth
-
Specifies the maximum depth criteria for a new or edited plot.
Note: If the minimum area and frontage criteria are met, and the maximum depth is exceeded, a command prompt displays that no solution is found. - Multiple Solution Preference
-
In certain situations, multiple valid solutions may occur during the creation of new plots. When multiple valid solutions occur, you can specify which solution is displayed.
Use Shortest Frontage: Specifies that the solution with the shortest frontage is displayed.
Use Smallest Area: Specifies that the solution with the smallest area is displayed.
Automatic Layout
- Automatic Mode
-
Specifies whether automatic mode is enabled for plot sizing commands.
On: Enables automatic mode.
Off: Disables automatic mode.
- Remainder Distribution
-
Specifies the method of redistributing the remainder.
Create Plot From Remainder: Creates a new plot from the remaining area.
Place Remainder in Last Plot: Places the remaining area in the last plot.
Redistribute Remainder: Redistributes the remaining area evenly to every plot.