In this exercise you use rubbersheeting to correct distortions in maps and scanned drawings that have a grid structure.
You can use the Grid Points feature in the Rubbersheet tool to create a regular rectangular pattern of control points for an image. In this exercise, you rubbersheet a map broken up into regular cells. After invoking Rubbersheet, you use the Grid Points function to define the grid of destination points. Then you use the Add Points function to pick source points for all of the destination points in the grid. After the control points for the grid are specified, you can rubbersheet the image using the Polynomial method.
Related Exercises
Before doing this exercise, ensure that AutoCAD Raster Design toolset options are set as described in the exercise Exercise A1: Setting AutoCAD Raster Design Toolset Options.
Exercise
- In the ..\Program Files\Autodesk\ApplicationPlugins\RasterDesign2024.Bundle\Contents\Tutorials\Tutorial2 folder, open the drawing file GridRubbersheet_01.dwg. The drawing includes an image of a scanned map.
- To display the
Rubbersheet-Set Control Points dialog box, on the ribbon, click
Raster Tools tab
 Correlate panel
  Rubbersheet
 .
.
- In the Method area, select Polynomial.
- Click the
Grid Points button to display the
Grid Parameters dialog box.
Set the grid parameters
In this box, you set the parameters for the destination point grid. The data to specify these parameters can be read from information in the image.
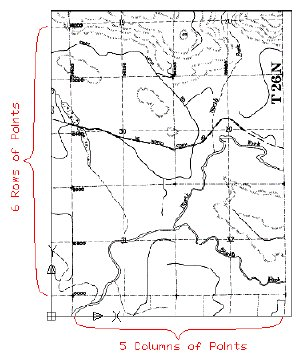
- Note that the image contains 6 rows and 5 columns of points that would approximate the grid contained in the image. In the
Grid Parameters dialog box,
Points section, enter
6 for
Rows and
5 for
Columns. Note the total number of points in the grid is shown so you know how many points can be used in the rubbersheet operation.
This example shows the rows and columns in the image.

- In the image, note that the grid origin (lower-left corner) should be at the point labeled 10000. The coordinates of this point are (37,400, 10,000). Under the Grid section, specify 37400 for X Origin and 10000 for Y Origin.
- Note the size of the grid cells in the image. They are 800 by 800. Under the Cell section, enter 800 for X Size and 800 for Y Size.
- Click
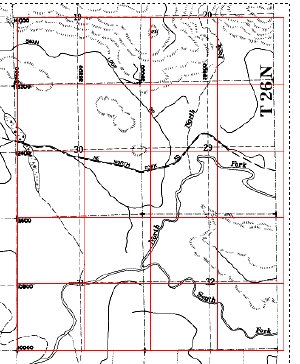
Preview to check the grid layout.
Note that each vertex of the new grid is close to the location of a vertex in the image grid. In the next part of the rubbersheeting process, AutoCAD Raster Design toolset takes you to each grid point (vertex) where you specify the source point in the image that will be stretched to the destination point on the grid.

- Right-click or press
Enter to exit the preview window.
Add the source control points corresponding to the grid
- In the Grid Parameters dialog box, click Add Points. The dialog box closes and the screen zooms and pans to the grid origin. Because this point was used to correlate the image, the source and destination points are correctly aligned.
- Enter
a to
anchor the origin point.
The command line prompts for point (0,1) and the display moves to this point, which is one cell over to the right.
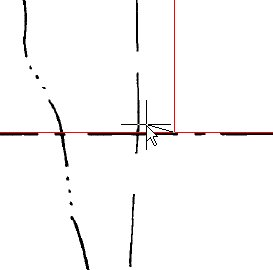
Tip: When adding source points, turn off OSNAP for better cursor control. - Pick the intersection of the dotted raster gridlines in the image as the source point for (0,1).
Note: You can change the zoom level for adding points. The new zoom level is maintained for subsequent point selection until it is changed again.

- Continue picking source points for every node in the grid. If any grid points are correctly aligned with a source point, enter
a to anchor the point. You can also enter
s to skip any point, or
u to go back and reposition one or more previous points.
Sometimes zooming out helps you position a source point when the intersection in the image is not clear. After you specify all the points, the Rubbersheet-Set Control Points dialog box displays to show the location of corresponding source and destination points.
Further exploration: You can select any row of this table, then right-click and zoom to that point to see how the current error level affects the actual destination of the point. If you increase the Polynomial Degree setting, the error level decreases for the control points, but this results in greater warping of the image in areas away from control points.
Setup and preview the rubbersheet
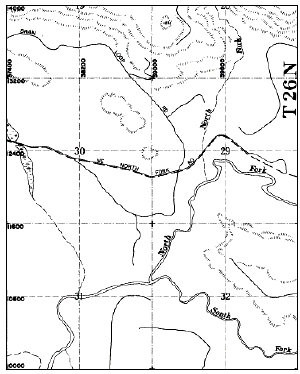
The preview indicates that areas outside the control point cluster are discarded in the final image.
- Select the
Preview button to preview the rubbersheet results. The red boundary shows the extents of the image after the rubbersheet, and the cyan boundary shows the data included in these extents. The hatched area is excluded from the new image.

- Right-click or press
Enter to exit the preview.
Perform the rubbersheet
Before performing the rubbersheet you export the control points in case the rubbersheet needs to be repeated.
- Click the Export button to display the Export dialog box. Name the file Grid_01.txt in the Export dialog box and click Export to finish the export.
- Click
OK. The rubbersheet operation occurs and the
Rubbersheet-Set Control Points dialog box closes.

- Close the drawing without saving changes.