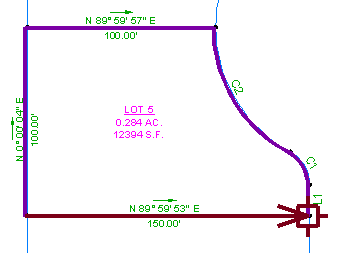
In this exercise, you will use the data in parcel segment labels to perform a mapcheck analysis.
The Mapcheck command checks the figure for length, course, perimeter, area, error of closure, and precision. It starts at the beginning of the figure and computes the figure vertex XY coordinates for each segment. These computations are based on the actual labeled values, and not the inverse direction and distance/curve data and the Linear and Angle precision (set in the Survey Database Settings).
This method of performing a mapcheck analysis is useful as a final check of closure. The data for the mapcheck analysis is taken from parcel segment labels. The precision of the mapcheck analysis is based on the precision of the labels.
This exercise continues from Exercise 1: Viewing Inverse and Mapcheck Information on a Survey Figure.
Set up the mapcheck analysis dialog box
- Open
Survey-5B.dwg, which is located in the
tutorials drawings folder.
This drawing contains a small subdivision with several parcels. All the parcel segments on the left side of the site are labeled. Notice that along the cul-de-sac, the line and curve labels have been converted to tags, and their data is displayed in a table on the left side of the site. You will perform a mapcheck analysis on parcel LOT 5.
- Click
tab
 panel
panel  drop-down
  Find.
Find.
- If a message that states that the command line mode cannot be used while a command is active is displayed, click OK.
- In the
Mapcheck Analysis dialog box, make sure that the
 Use Command Line Interface option is toggled on.
- Click
 Input View.
The input view provides an interface in which you can add data to the mapcheck analysis.
Perform a mapcheck on parcel labels
- Click
 New Mapcheck.
- On the command line, for the name of the mapcheck, enter Parcel Labels.
- When prompted to specify a point of beginning, click the intersection of the lot lines under label tag
L1.
The
 icon indicates the point of beginning.
- Select the
L1 label tag above the point of beginning.
A temporary arrow graphic is displayed at the point of beginning. Notice that the arrow is pointing away from LOT 5.
- On the command line, enter R to reverse the direction of the arrow.
- Select the
C1 label tag.
Notice that the temporary line and arrow are pointing in the wrong direction.
- Enter F to flip the arrow.
- Select the C2 label tag.
- Select the bearing over distance label to the left of the arrow. Enter R to reverse the direction.
- Select the 100.00’ portion of the bearing over distance label below the arrow.
A
 icon appears at the end of the current line, and the command line states that there is not enough data to define the segment. This happened because the current segment is a lot line that is shared by all the parcels on the left side of the site.
- Select the bearing portion of the label. Enter R to reverse the direction.
- Select the bearing over distance label to the right of the arrow.
The arrow returns to the point of beginning.

- Press Enter to end the command.
In the Mapcheck Analysis dialog box, notice that you can edit any of the sides you created during the mapcheck analysis.
- Click
 Output View.
The Output View displays the results of the mapcheck analysis. You will learn how to work with the output data in Exercise 4: Working with Mapcheck Data.
To continue this tutorial, go to Exercise 3: Performing a Mapcheck Analysis by Manually Entering Data.