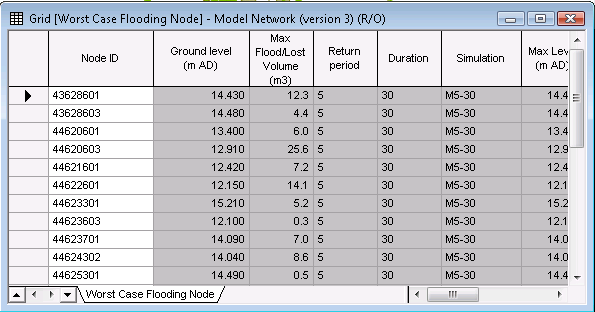
The Worst Case Report analyses a number of simulations and shows the worst case for a chosen result parameter at each node or conduit.
The options for InfoWorks simulations are:
- Node - Flood Depth, Flood Volume or Level
- Conduit - Downstream Flow or Upstream Flow
The options for SWMM simulations are:
- Node -Depth, Head or Total Inflow
- Conduit - Capacity, Flow or Velocity
Choose the parameter for the report on the Worst Case Grid Report dialog.
The grid displays:
- The node or conduit ID
- The worst case of the selected parameter at that node or conduit
- The simulation which caused the worst case
- Return period and duration (if information available from rainfall event)
- The other summary results for the node or conduit from the simulation that caused the worst case
The following image shows an example of a worst case report for flood volume for nodes included in an InfoWorks simulation.

For full details on setting up a Worst Case Report, see Grid Reports.