Answer questions about your data and make decisions.
- Sort, filter, and edit information about map items in a tabular format.
- Temporarily join data from external data stores to features in your map and use that data to theme the features.
- Locate specific coordinate points and measure the geodetic distance between points.
- Visually communicate relative values and scale with themed displays.
- Create contour maps to help you analyze 3D terrain.
- Use raster-based theming to analyze elevation, slope, and aspect, drape map data over surfaces and view the data in 3D, and more.
- Create buffer zones based on feature properties and select objects based on their proximity to a buffer. Save the buffer as its own feature class, for future reuse.
- Overlay two geospatial layers to compare their data. Save the resulting data as a separate layer, which you can join to attribute data or theme.
Theme Data
Use color themes to show the elevation of terrain or illustrate the population density of counties.
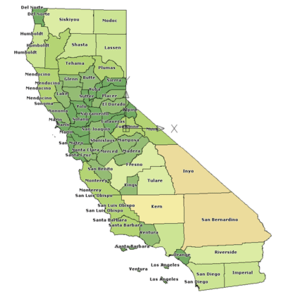 |
The colors give the viewer an immediate sense of the population distribution in California |
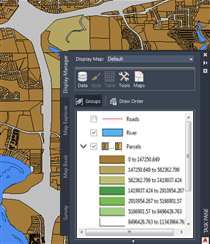
| Create themes by varying the style based on an attribute of the feature; for example, change the color of parcels based on their size. |
 |
Analyze Surfaces
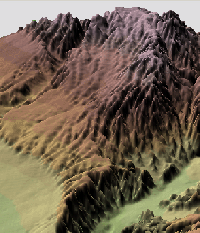 |
Create contour maps and analyze geospatial data by exaggerating elevations or looking at maps in different light conditions. |
Create Buffers
Use buffers to analyze features by proximity.
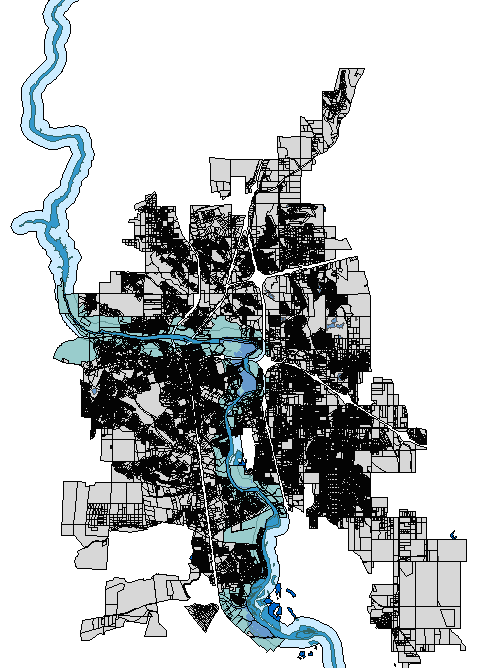
The buffer in this map defines an area within 1000 feet of the river. You can use the buffer to see which parcels lie within the flood zone.
Overlay Two Feature Layers
Use overlays to compare two feature classes or layers.
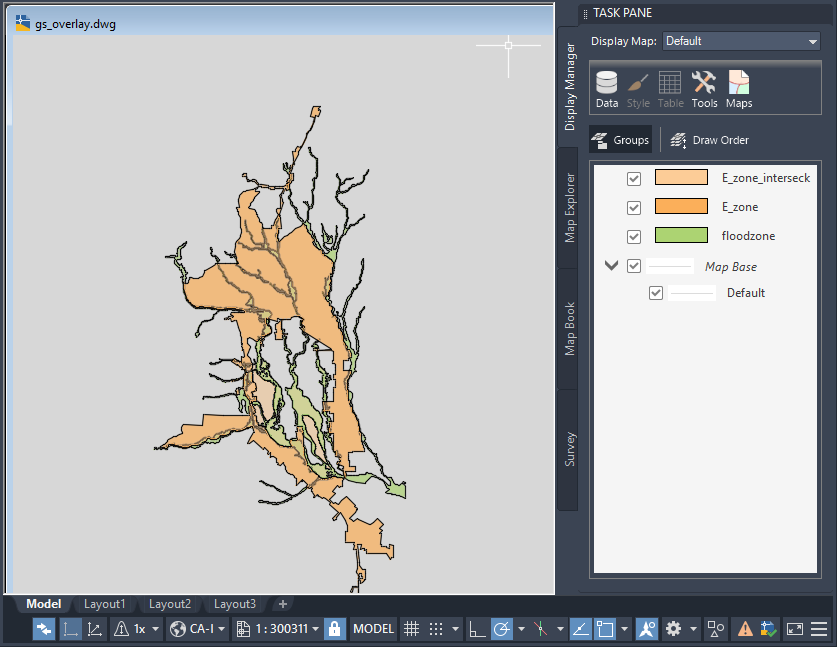
This map overlays two layers (a flood zone and an enterprise zone). You can use the overlay to see where the two intersect. That area becomes a new layer, which you can style and save out to a file and use as a separate data store.
Added Analysis with Industry Models
When you use industry models , you have access to functionality that is not available to non-industry model drawings:
- Analysis tools
You can analyze a network topology (sometimes called tracing) using Network Analysis. For example, trace a wastewater network from one or more designated start features to an optional end feature. Network tracing begins from the start location and ends when all end features have been reached. You can also set attribute-dependent stop conditions, locate point objects on a pipe, locate point objects that are not connected to the network, or pinpoint error in a network topology.
- Forms
Like the Data Table, forms display the attributes for features. However, instead of displaying the attributes for all features in the feature class, a form lets you view and edit the attributes for a single feature.
- Reports
Generate default and user-defined reports. For example, create a parcel report that lists area, distance between the parcel border points, parcel borders, points, and parcel numbers. You can perform spatial selections for the reports. For example, you can select all features that lie within a specified area.
Tell me more
|
|
|
|
|
 Procedures
 Related topics
 Video
Video
 Tutorial