Review the compression molding press force results
In this task you review the press force results of the compression molding process.
To review the Press force: XY plot
Click Press force:XY Plot in the Study Tasks list.
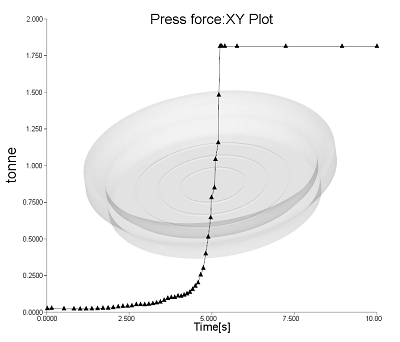
The Press force:XY Plot result shows the force applied by the press over the duration of the analysis, displayed on an XY plot of force versus process time. The maximum press force of about 1.8 tonne is reached shortly after 5s which corresponds to when the press closes completely. Similarly to when the cavity volume stabilized as seen in the previous result.
Compare this plot with the process settings used for the analysis. The press force is calculated by multiplying the pressure by the projected area of the compression surfaces on the parting plane, at specific time instants.
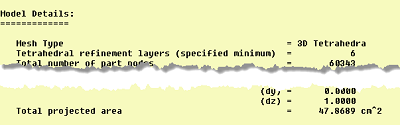
From the model details in the log file you have that the projected area is 47.8689 cm2.
If you look at the log file filling phase you find the press pressure after the V/P switch over of 3.715 MPa.
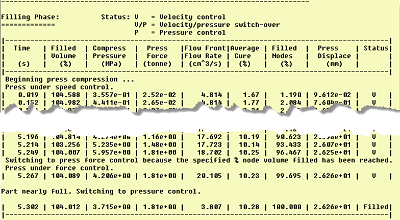
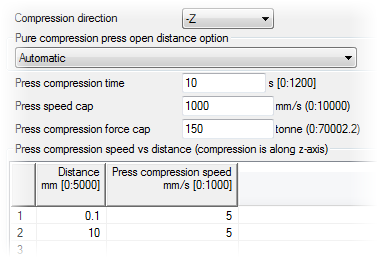
Multiply the pressure by the projected area and you have the press force of 1.81 tonnes which corresponds to the press force result. This value is well below the press compression force cap of 150 tonnes set in the analysis so the machine selected is within specifications.
Parent topic: Compression Molding
Previous topic: Review of the cavity volume: XY plot
Next topic: Review the press speed results of the compression molding process