Review of the cavity volume: XY plot
In this task you review the Cavity volume: XY plot. This plot provides you with information regarding how appropriate or not were the process settings used in the analysis. You can use this information to optimize the process.
Click the result Cavity volume:XY plot in the Study Tasks list.
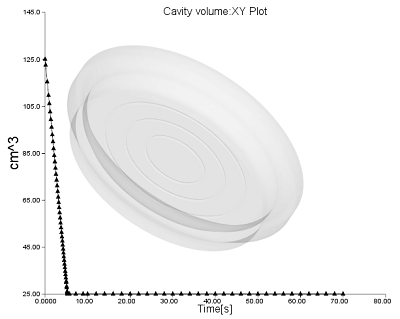
The Cavity volume:XY plot shows the change in unfilled volume of the mold cavity versus time between the moving and fixed halves of the mold during the compression analysis. It includes the increased volume that results from the mold halves being slightly open at the start of the process.
Compare the Cavity volume:XY plot result against the compression settings that were set as part of the process settings.
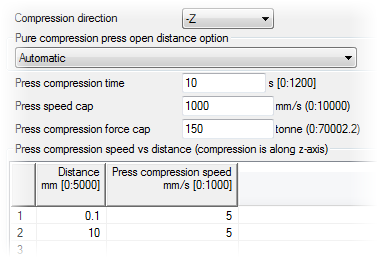
The compression speed(s) and press compression times should correspond to the graphical result. The process settings specified for this part are: compression time 10s and the cure was 60s. Therefore, the cycle time is 70s. This time corresponds to the end of the data in the x axis.
Since the compression open distance was set to automatic you need to look in the log for the press open distance which is 26.5 mm.
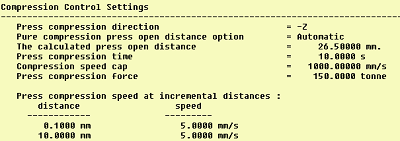
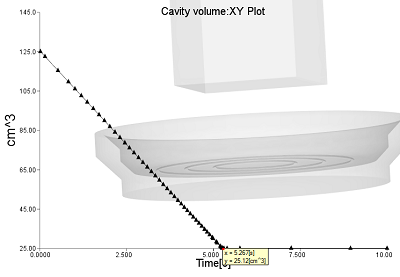
If you divide the open distance by the press speed you will find that the press closes at 5.3s. Once the press stops moving the cavity volume should not change as shown in the image. The volume of the cavity stops changing around 5s. The compression time may be reduced to match such time as you optimize the process to reduce cycle time.
Compare the final cavity volume as reported by the Cavity Volume:XY plot, to the volume of the mesh model, as reported in the analysis log.
The volumes should be close to each other where the model volume should be slightly larger than the cavity volume reported in the XY plot. If the volume reported in the Cavity volume:XY plot is larger than the model volume this may be an indication that the melt has cooled below its transition temperature (or the material has cured in the case of thermoset materials) before the mold had closed to the intended cavity volume.
Parent topic: Compression Molding
Previous topic: Review of the compression surface property assignment
Next topic: Review the press force results of the compression molding process