Note: Debugging is not available in AutoCAD LT.
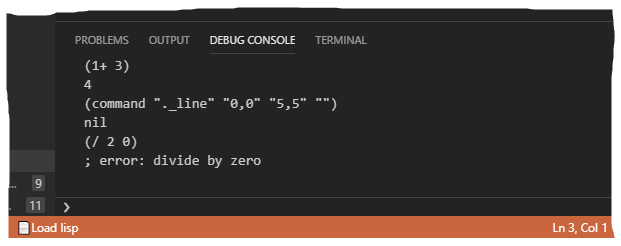
When an instance of the AutoCAD application is attached to VS Code, you can enter and execute AutoLISP expressions in the Debug Console.
- In Visual Studio Code, start debugging an AutoLISP source (LSP) file.
- On the Activity Bar, click Debug and Run (or click View menu > Debug).
- In the Debug Console, at the prompt, enter the AutoLISP statement to execute.
 Note: If the Debug Console window isn’t open, click View menu > Debug Console (or press Ctrl+Shift+Y).