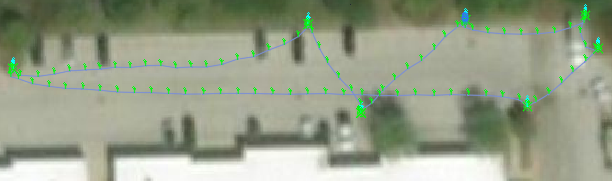
Processed RINEX data is displayed in the Civil 3D drawing area as points and paths (if specified).
You can quickly preview the locations of points as defined in the Processed Data Results grid using several of the tools provided. Selected points will be highlighted in both the Processed Data Results grid and the drawing area.
- Click a point to select it.
- Press and hold Ctrl to select multiple points.
- Press and hold Shift to select a range of points.
Select nearest point to a location. Click Select Nearest in Drawing Window
 and click in the drawing area. The point closest to where you click will be selected.
Select a group of points in the drawing area. Click Select by Window
 and click two locations in the drawing area to define the area in which points are selected.
Clear a selection. Click Clear Selection
 to deselect all currently selected points.
Panning to selections. If the surveyed area is currently out of view in the drawing area, click Pan to
 to bring it into view.
- Select one or more points in the data results grid and click Zoom to
 .
.
- Click Zoom All
 to zoom to the extents of the processed points in the data results grid.