In this exercise, you will create a table to display information about plot objects.
You use a similar workflow to create tables for most Autodesk Civil 3D objects. In this exercise, you will learn about the table tools in Autodesk Civil 3D, and the dynamic nature of externally referenced drawings. You will add a plot area table to an externally referenced drawing, and then examine the results in the host drawing.
To create a table for an object, the object must be labeled. Most tables require that you specify the table data by selecting a label style. In this exercise, you will select plot area labels to create a plot area table. However, the plot and area labels exist in an externally referenced drawing. Plot area tables cannot be created through xref, so you cannot create the table in the current drawing.
Apply a simpler plot area label style
- Open Labels-4a.dwg, which is located in the My Civil 3D Tutorial Data folder.
- Open Labels-Parcels.dwg, which is located in the My Civil 3D Tutorial Data folder.
- In Labels-Plots.dwg, zoom in so that you can see all of the plots adjoining East Street, which is the cul-de-sac alignment on the right-hand side of the drawing.
You will apply a simpler area label style to plots 37 through 41, and then create a table that will display detailed plot data.
- In Toolspace, on the Prospector tab, expand Sites
 Site. Click the Plots collection.
 - In the item view at the bottom of Toolspace, use Shift+click to select plots number 37 through 41. Right-click the Area Label Style column heading. Click Edit.
- In the Select Label Style dialog box, select
Plot Number
. Click OK.
The plot area label consists of the plot number only. In the following steps, you will create a table that displays detailed information about each of these plots.
Before you begin this exercise, you must have the provided Labels- drawings saved in the My Civil 3D Tutorial Data folder. See the Attaching Drawings as Xrefs for Annotation exercise for more information.
Create a plot area table
- Click tab panel menu .
- In the Table Creation dialog box, in the Select By Label Or Style area, in the
Plot Number
row, select the Apply check box.
You can select multiple styles from which to create the plot table. All the plots that use the selected styles will be shown in the table.
- Click OK.
When you move the cursor into the drawing area, the upper left corner of the table is attached to the cursor.
- Move the cursor to the right of the plots and click.
The table is inserted into the drawing.
- On the Quick Access toolbar, click
 Save.
Save. - Close the Labels-Plots drawing.
Examine the results in the current drawing
- In drawing Labels-4a, on the command line, enter XREF.
- In the External References palette, right-click Labels-Plots. Click Reload.
The current drawing is rebuilt using the updated data from the Labels-Plots drawing. Notice that the plot area table you created in the externally referenced drawing is shown, and the plots at the end of the East Street alignment use the Plot Number area label style.
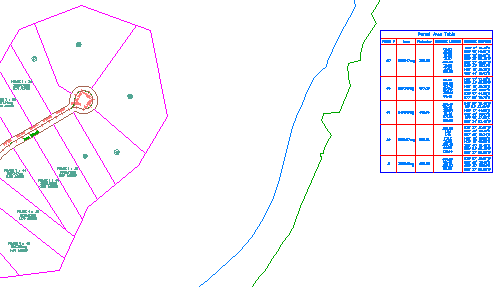
Plot area table added to an externally referenced drawing
To continue this tutorial, go to Exercise 2: Converting Labels to Tags.