In this exercise, you will create some plot segment labels, and then convert the labels to tags and move the data into a table.
In Exercise 1: Creating a Plot Area Table, you created a table in the externally referenced Labels-Plots drawing. In this exercise, you will create plot segment labels directly in the current drawing. You will then convert the segment labels to tags and create a table to display the detailed label information.
This exercise continues from Exercise 1: Creating a Plot Area Table.
Label the plot segments
- Click tab
 panel menu
  .
.
- In the Add Labels dialog box, specify the following parameters:
- Label Type: Multiple Segment
- Line Label Style: Plot Line Label StyleBearing Over Distance
- Curve Label Style: Plot Curve Label StyleDelta Over Length And Radius
- Click Table Tag Numbering.
- In the Table Tag Numbering dialog box, examine the settings that are available.
The settings specify the starting number and increment for line, curve, and transition tags. Notice that there are separate starting number and increment properties for both Table Tag Creation and Table Tag Renumbering. For this exercise, accept the default value of 1 for all properties. When you convert the labels to table tags, they will all use a starting number and an increment of 1. You will use the Table Tag Renumbering properties later.
- In the Table Tag Numbering dialog box, click Cancel.
- In the Add Labels dialog box, click Add.
- Click the plot area labels in the following order: 39, 40, 41, 37, 38. Press Enter to accept the default Clockwise label direction.
As you click, labels are placed on each plot segment. If you wish, zoom in to inspect the labels before you convert them to tags.
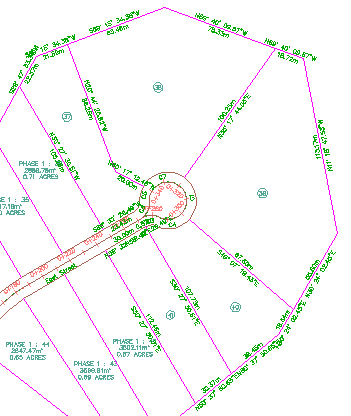
Plot segment labels
- When you finish labeling plots, right-click to end the command.
The Add Labels dialog box remains open, in case you want to label more plots or other objects. You can close it, as you will not use it again in this exercise.
This exercise uses Labels-4a.dwg with the modifications you made in the previous exercise.
Place the segment labels in a table
- Click tab panel menu .
This option creates a table that shows both the line and curve segments of the labeled plots.
- In the Table Creation dialog box, in the Select By Label Or Style area, select the Apply check box for the two label styles you placed on the plot segments:
- Plot Curve: Delta Over Length And Radius
- Plot Line: Quadrant Bearing Over Distance
- Click OK.
When you move the cursor into the drawing, the upper left corner of the table is attached to the cursor.
- Move the cursor outside the surface extents and click.
The table is inserted into the drawing. Notice that the line and curve labels around the plots have been converted to tags.
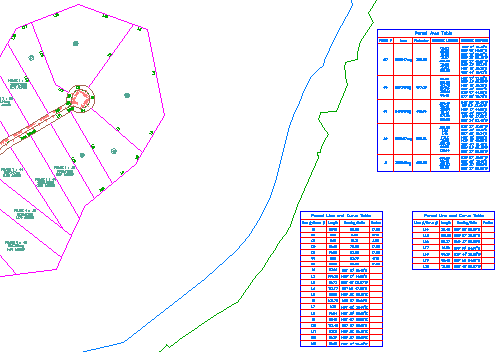
Plot segment labels converted to tags, with a plot segment table added to drawing
To continue this tutorial, go to Exercise 3: Renumbering Table Tags.