In this exercise, you will resize a plot by sliding an attached plot line along the plot frontage.
Specify plot creation settings
- Open Parcel-2A.dwg, which is located in the tutorials drawings folder.
- Click tab
 panel drop-down Find.
- On the Plot Layout Tools toolbar, click
 .
.
- Specify the following parameters:
As you specify each parameter, notice that a preview graphic is displayed at the bottom of the Plot Layout Tools window.
Plot Sizing
Automatic Layout
- Minimum Area: 8000.00
- Minimum Frontage: 40.0000
- Use Minimum Frontage At Offset: Yes
- Frontage Offset: 20.0000
- Minimum Width: 40.0000
- Minimum Depth: 50.0000
- Use Maximum Depth: Yes
- Maximum Depth: 200.0000
- Multiple Solution Preference: Use Smallest Area
- Automatic Mode: Off
- Remainder Distribution: Place Remainder In Last Plot
Slide a plot plot line
- In the Plot Layout Tools toolbar, click
 Slide Line - Edit.
- In the Create Plots – Layout dialog box, click OK.
You are prompted to select the attached plot line to adjust.
Note:An attached plot line is one that was created with the slide angle, slide direction, and swing line precise sizing tools available on the Plot Layout Tools toolbar. You can use the slide line edit command to edit only attached plot lines. You will learn how to edit lot lines created using other methods in Exercise 3: Editing Plot Lot Line Geometry.
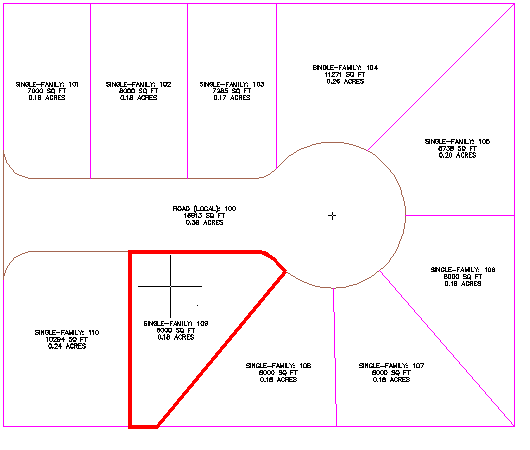
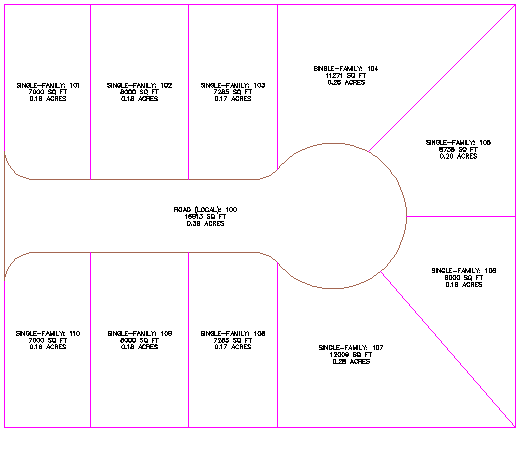
- In the drawing, click the plot line that is between plot 108 and plot 109.
- Select the plot to adjust by moving the cursor over property 109. The plot borders are highlighted. Click inside the plot.
- Specify the plot frontage as shown in the following image.
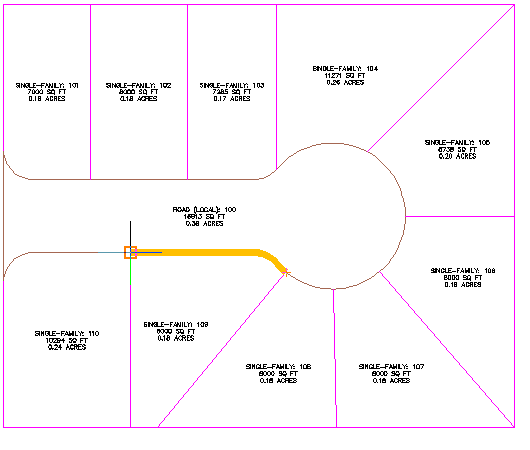
- Enter a frontage angle of 90.
Preview graphics of the plot creation parameters and proposed solution are displayed. The displayed solution slides the plot line along the frontage at the angle specified. The proposed solution encloses an area that meets the plot creation parameters you specified at the beginning of this exercise.
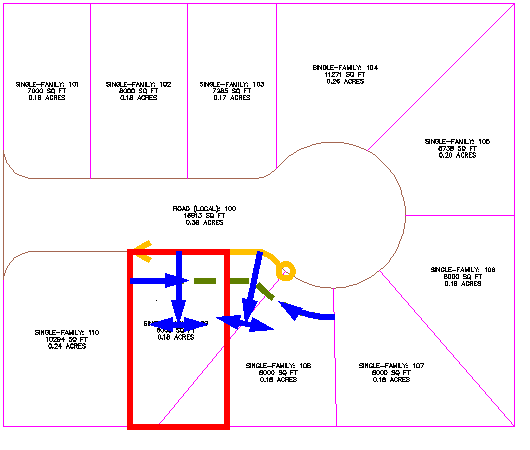
- Press Enter.
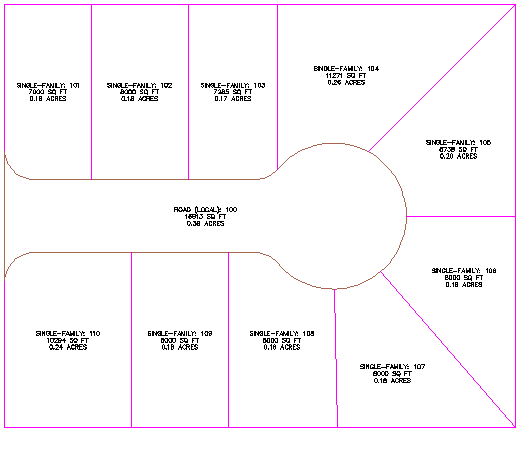
Further exploration: Use Steps 3 through 8 to move the plot lines that are between plots 108, 109, and 110 to match the plot layout of plots 101, 102, and 103.
- Press Esc to end the command.
To continue this tutorial, go to Exercise 2: Swinging One End of a Plot Lot Line.