Use the Graphics window Point-Cloud tab to view information about the Point-Cloud item selected in the inspection sequence.
When the point-cloud is projected onto the CAD model, the tab displays the following:
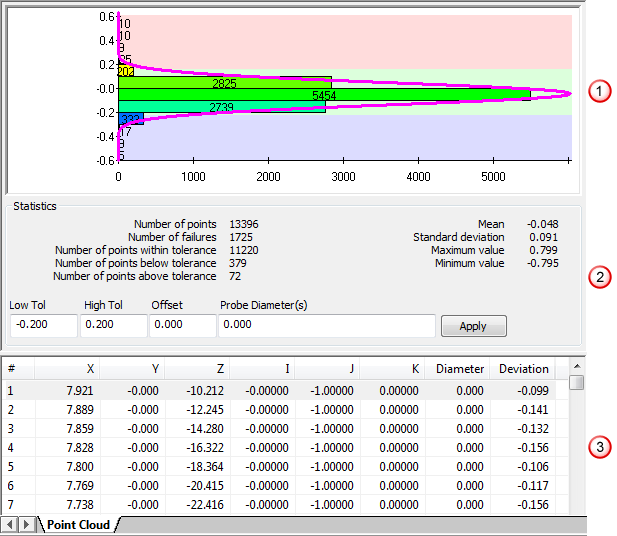
 Graph — Displays the distribution of the deviations from the CAD surface. Use the Graph View Options panel on the View tab to zoom in and out of the graph.
 Statistics — Displays information about the point cloud and the number of points above, within, and below tolerance. To change the tolerances, surface offset, or probe diameter for the point cloud, enter new values in the appropriate boxes, and then click Apply.
 Table — Lists the unique identifier (#), position (X, Y, Z), normal vector (I, J, K), the Diameter of the probe, and the Deviation from the CAD surface for each point.
By default, the table is sorted by point identifier(#). To sort the points using another column, click the column heading: click once to sort the points in descending order; click twice to sort the points in ascending order.