Generate a loads report when you need detailed information for loads and psychrometrics to guide the sizing of HVAC equipment.
From within Revit, you can:
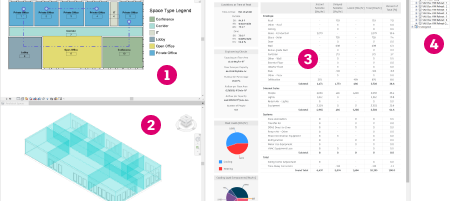
 View a floor plan
 View a 3D view
 Examine loads and psychrometric results
 Examine the systems analysis schematic
The loads report has three main sections: Zone Load Summary, System Load Summary, and Design Psychrometrics.
- Understand what is contributing to the load
- Provide high-level QA/QC metrics in the engineering checks
- See the total sensible (instant and delayed), latent, and total load for sizing systems
Use the Design Psychrometric report to see the psychrometric cycle of air through the system and assess whether the cycle is as expected. The report lists various physical and thermodynamic properties of air at constant pressure to aid with troubleshooting.
- Select the unit system for viewing the data: Revit units, Imperial (IP) units, or metric (SI) units
- Print a PDF of the report

Zone Load Summary
The Zone Load Summary allows you to select a zone to examine in the top left
, as well as toggle between cooling and heating loads
. Within the report a table shows the contribution of load from each categorical subsection
. The grand total shows the total sensible (delayed and instant), total latent, and total load for use in sizing components
.
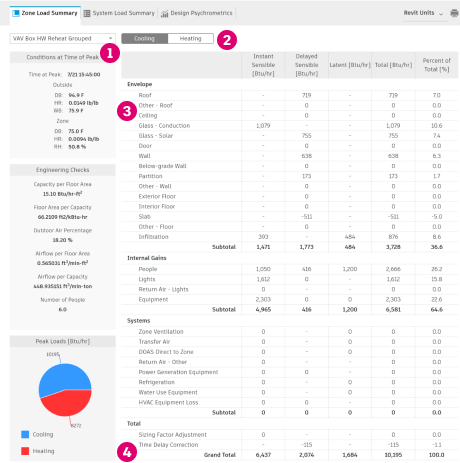
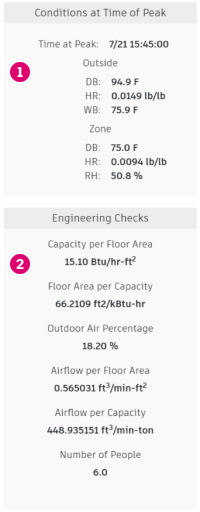
The report includes a subsection that details the environmental conditions during the peak
and a few high-level metrics for QA/QC purposes
.
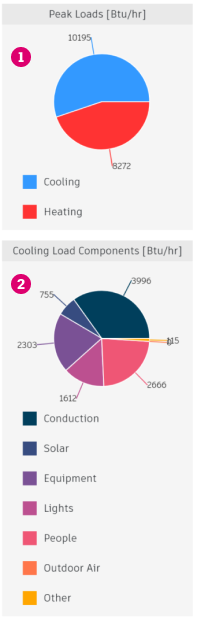
Pie charts provide:
A visual aid to understand the peak load for cooling and heating relative to each other
A total sum of similarly related sources of load
System Load Summary
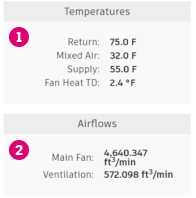
The System Load Summary contains similar information to the Zone Load Summary, with the following additions:
The temperature of the air at various points of the system
The main fan air flow and ventilation flow
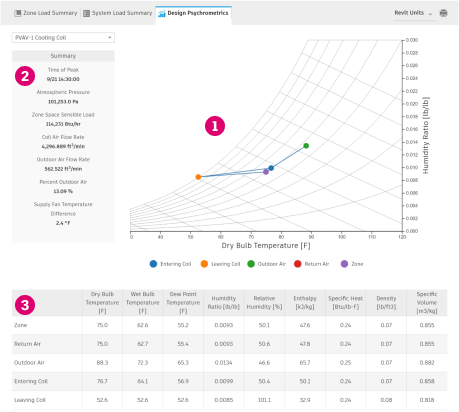
Design Psychrometrics
The Design Psychrometrics report shows the psychrometric state points of air for any system that contains a cooling coil. Primarily, this report shows a psychrometric chart to see the state of air at each point of a system
. A summary table highlights various related system properties
. Finally, a table below the chart provides the specific values for psychrometric state points at constant pressure shown in the chart
.