About pressure related demand
Introduction to pressure related demand
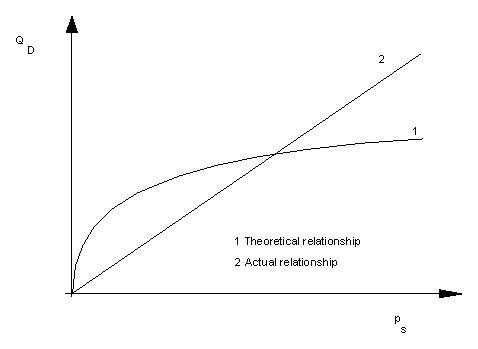
Local service pressures have an influence on demands and losses in the network. Higher pressures lead to increased consumption and losses. This is particularly true for leakage losses, where a standard relationship has been established based on the measurements in several existing water supply systems ( Leakage Control Policy and Practice, 1980 ).
|
| 1. Theoretical Relationship between flow through an orifice and pressure drop across it |
| 2. Actual relationship between losses and service pressure derived from trials carried out to measure reduction in leakage ( Leakage Control Policy and Practice, 1980 ) |
A similar relationship could not be made for consumption, because many other factors are also relevant.
By default, InfoWorks WS Pro calculates demand without reference to the actual pressure at a node. To provide more accurate modelling of demand, InfoWorks WS Pro provides a pressure-related demand option.
Use of the pressure related demand option
A model calibrated against measured demands indirectly takes the effects of pressures in the network into account. If simulation conditions are similar to calibration conditions, the use of the model without using the pressure related demand option is still valid.
The pressure related demand option is recommended for use in simulations where the hydraulic conditions will make a significant difference to the heads observed in the network compared with the calibration model.
Caution: You are advised to experiment carefully with this option since it is dependent on accurate ground levels and working pressures. Bear in mind that with the pressure related demand option activated, total demand depends on the results of simulation and cannot be predicted accurately. The user must treat the output with care.
When the pressure related demand option is switched on:
- The pressure at each node is compared to a standard service pressure (average pressure in normal circumstances) defined in the Nominal Pressure field of the node object. (Nominal pressures can be updated automatically from previous simulations.)
- The nominal pressure value corresponds to the nominal demand specified in the demand diagram profiles. The ratio between simulation pressure and nominal pressure is calculated and used to determine a demand factor from PRD curves (defined in the PRD Curve Grid view in the Nodes grid).
- The demand factor is applied to the percentage of the demand profile flagged as being pressure related (in the demand diagram or in the Pressure Related Demand Options dialog).
Procedure for running a pressure related demand simulation
- Run a base model (for example, calibrated model) to determine nominal pressures.
- Update network nominal pressures from base model pressures.
See Updating nominal pressures for further information.
- Define consumption and leakage demand factor / pressure ratio relationships (PRD curves) via the PRD Curve Grid view in the Nodes grid.
- In the
demand diagram, set the percentage of each demand profile that is to be considered as pressure related.
Optionally, a global percentage may be specified in the Pressure Related Demand Options dialog.
- In the Schedule Hydraulic Run view:
- Check the Pressure Related Demand box.
- Click the Pressure Related Demand Options button to select the PRD curves to be applied to demand profiles.
A previous simulation may also be selected from which nominal pressures will be calculated.
- Set further options as required from the Pressure Related Demand Options dialog.
- Run the new simulation.
Calculations
Demand and Leakage at each node is calculated as follows:
Actual consumption:
|
|
Where: QC(nominal)= Nominal Consumption defined in Demand Diagram profile %D = Percentage of demand profile that is pressure related FC = Demand Factor from Consumption PRD Curve |
Actual losses:
|
|
Where: QL(nominal)= Nominal Leakage value defined in Demand Diagram profile %D = Percentage of leakage profile that is pressure related FL = Demand Factor from Leakage PRD Curve |