Exercise 17
Previous: Exercise 16 | Next: Chapter 23
This exercise teaches how to use the Decision Center to compare results from different designs and scenarios with Summary Images and Critical Data.
In this exercise, we will update the summary images and critical values entities that we originally created for the baseline design with results from the new design.
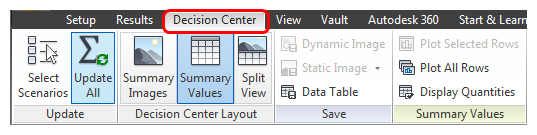
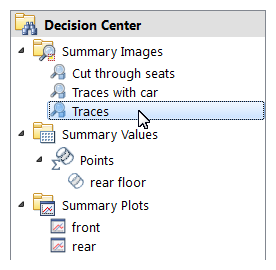
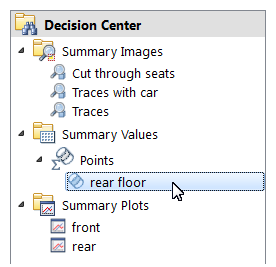
To begin, open the Decision Center by clicking the Decision Center tab:
To update all images, values, and plots to include the new design, right click on the Decision Center bar and select Update all.
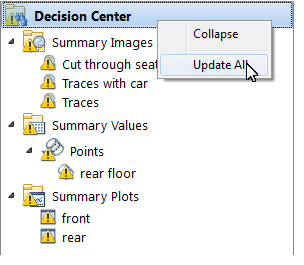 Note: The "warning" symbol adjacent to the objects in the Decision Center indicates that one or more scenarios in the design study are either not included or are not current in the Decision Center object. Clicking Update all extracts the latest results from all scenarios, and applies them to the decision center objects.
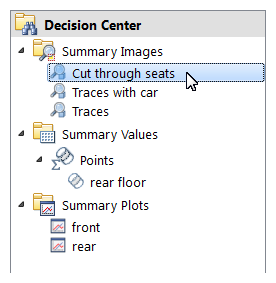
Click the Cut through seats Summary Image (under the Design Review Center branch).
 Note: Note that the saved view of the baseline design is displayed.
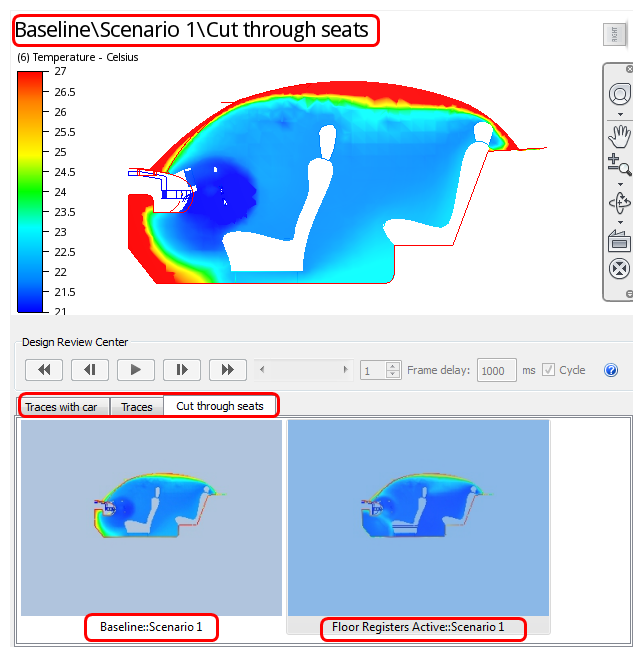 Note: Each Summary Image is listed in a separate tab. Each tab displays the saved Summary Image for all completed scenarios in the design study.
To view the Summary Image for both designs simultaneously, divide the graphics window into two viewports:
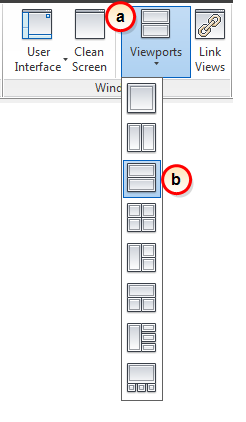
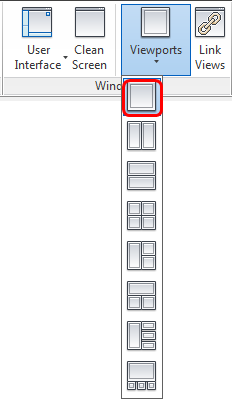
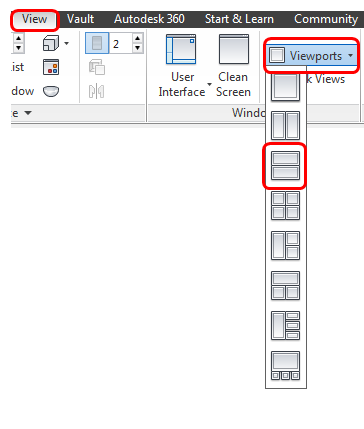
Expand the Viewport menu on the View tab.
Select Horizontal split views.
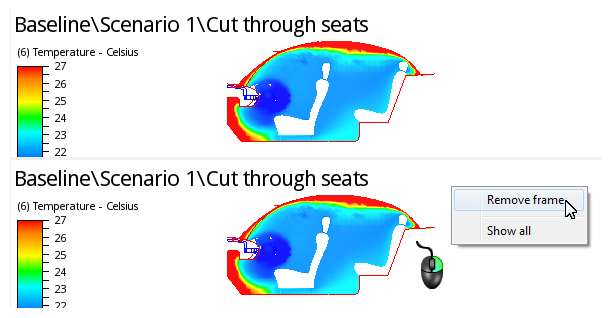
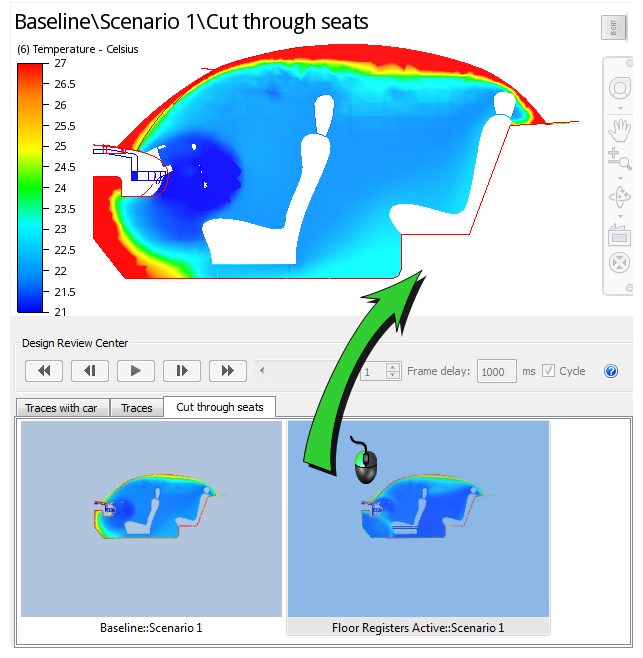
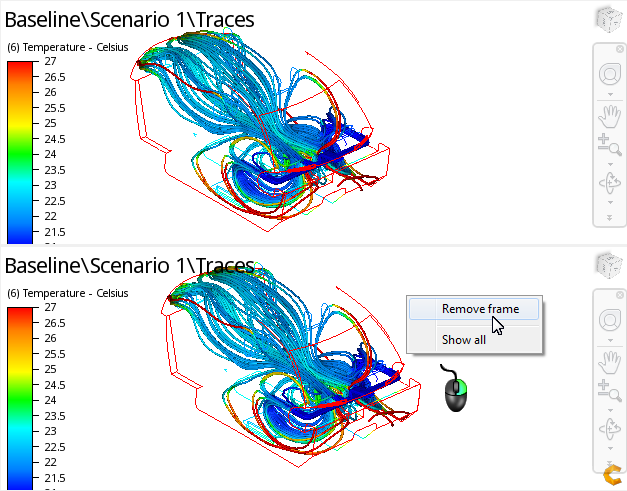
Both viewports display the same image. To remove one of the images, right click in the lower viewport and select Remove frame.
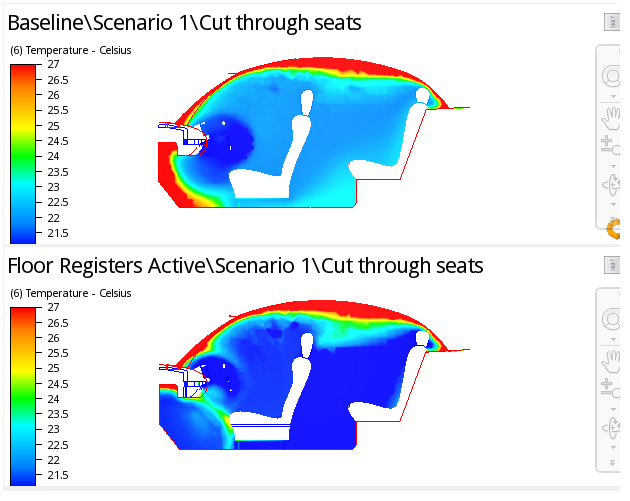
Drag the Floor Registers Active image from the Output Bar into the lower viewport.
Note the much cooler temperatures in the new design, shown in the lower viewport. Also note the more uniform cooling of the rear occupant space:
Display a single viewport from the Viewports menu.
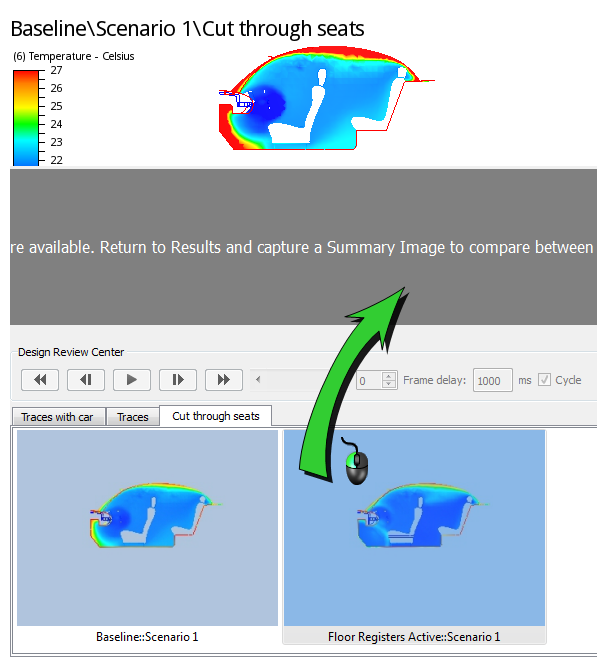
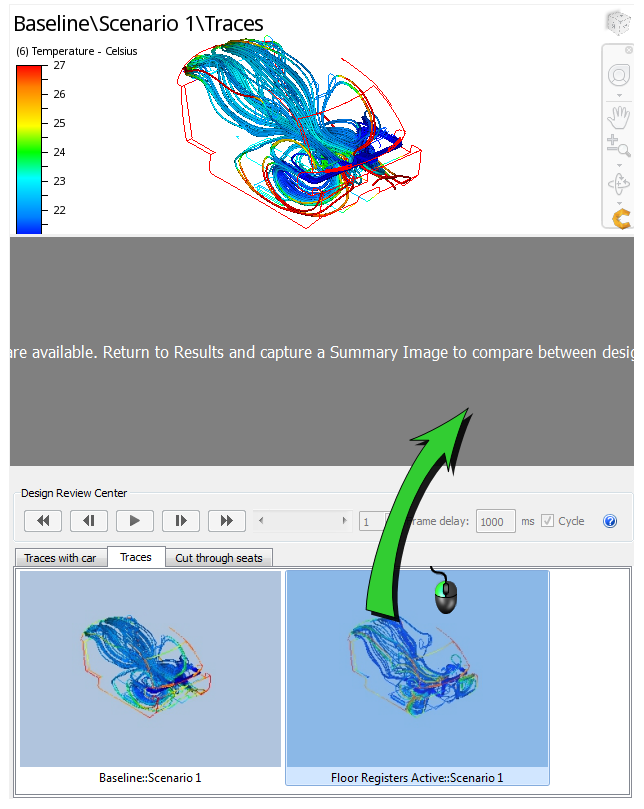
 Note: An alternative way to compare design results is to place the summary image from both designs into a single viewport, and animate the display.
Drag the image not currently displayed in the viewport from the Output Bar into the single viewport. (The Floor Registers Active image is shown being dragged below.)
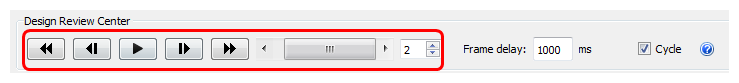
Use the "VCR" controls or the slider bar to animate between the two designs.
To view flow pattern changes, click the Traces Summary Image (under the Design Review Center branch).
Compare the results from the two designs using the Traces Summary Image:
Change to two horizontal split views.
To remove the image from the lower viewport, right click, and select Remove frame.
Drag the Floor Registers Active image into the lower viewport.
To navigate the views together, make sure that Link Views from the View tab is pressed.
Note: The recirculation that caused the uneven heating in the baseline design is eliminated in the new design. Note, however, that there is some recirculation at the front of the floor space.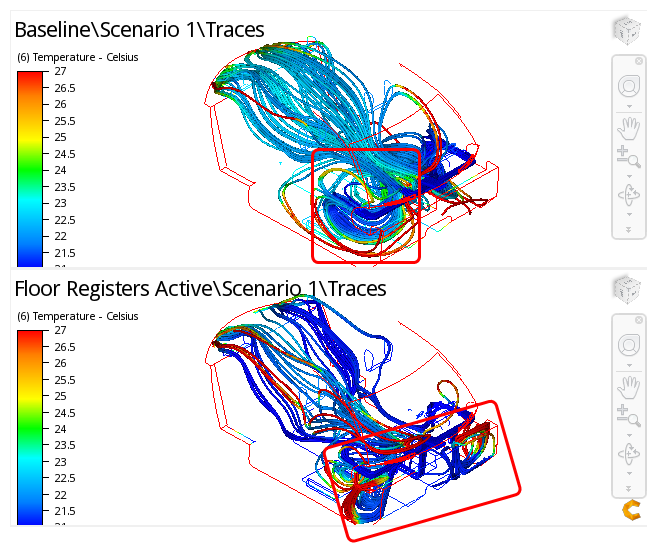
Select the rear floor summary point from the Summary Values branch of the Decision Center.
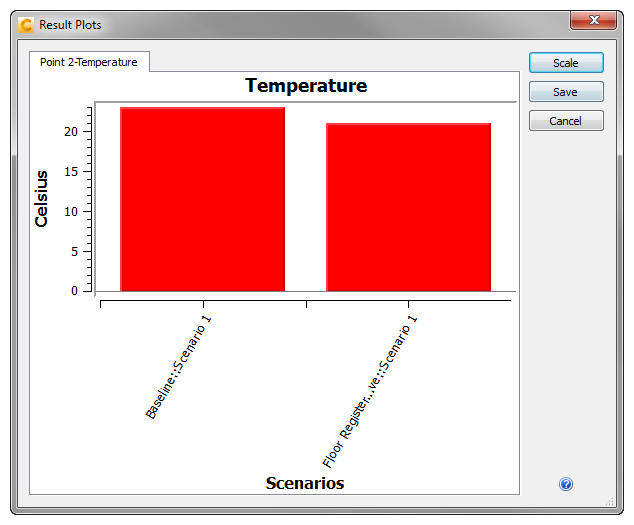
Select Temperature, and click Plot Selected Rows.
Note: Note the reduction in temperature at this location in the new design: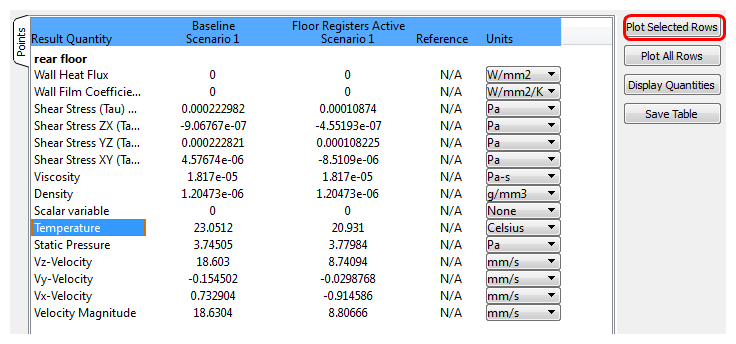
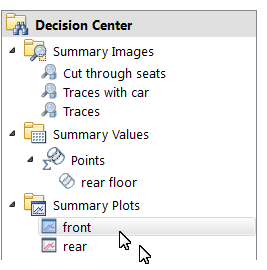
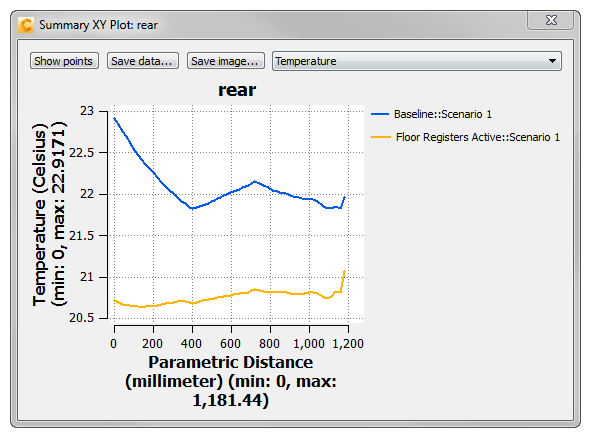
To view the temperature plots of the front and rear occupant space, click the front and rear Summary XY Plot entries (under the XY Plot Data branch).
Observations:
The new design (plotted in yellow) shows temperature gradients of less than 2° C from the roof to the floor of each occupant space.
The average temperatures in the front and rear occupant spaces differ only by about 1° C.
The variation of temperature within both occupant spaces is much lower than in the baseline design.

 Note: New Summary Plots, Summary Values, and Summary Images can be added to the Design Study at any time. Just return to the results branch of any scenario, create the summary item or image, and then update the resulting new entry in the Decision Center.
When finished, close all plot windows by clicking the X in the top right corner.
Conclusion
Adding registers to the floor in the front and rear of the car passes our design criteria by keeping temperatures in front and rear occupant spaces within 2° from top to bottom, and less than 2° difference from front to back. This new design also achieves our design goal of uniform cooling over each passenger (see Exercise 1 to review these goals and success criteria).
Challenge
Now that you have learned to use Autodesk® CFD to compare different designs, why not challenge yourself to test other changes to this model?
- What happens if only the front registers are active?
- ...or only the rear registers?
- What happens if you activate the defrost registers in the top of the console?
- What if you change the angles of the four front registers?
You can make these changes in the CAD model and launch into new cloned designs in this design study. Simply repeat the process described in Exercise 15 and this exercise.
In addition to varying geometric configurations, you can experiment with changing physical parameters:
- What about using different flow rates?
- Different temperatures?
Simply clone Scenario 1 in the Design Study Bar and change the boundary conditions in the cloned analysis – without leaving Autodesk® CFD! See Chapter 22 for details.