Exercise 9
Previous: Exercise 8 | Next: Chapter 16
This exercise teaches how to use results planes to understand your flow and heat transfer results.
Air Flow
To view the air flow out of the front registers, left click on the results plane and select the Y icon. Then drag the plane so that it passes through the registers as shown.
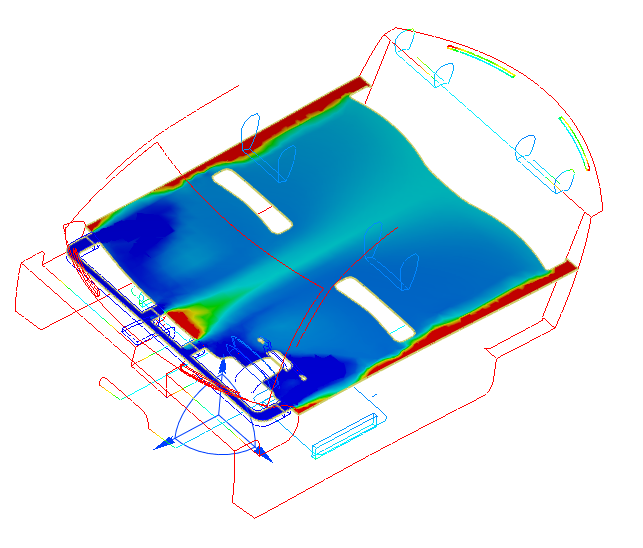 Note: Notice the warmer areas in the center and near the sides of the rear seat.
To view velocity on this results plane, select Velocity Magnitude from the Result menu on the Planes context panel.
Probe velocity by hovering the mouse over the results plane. Look for the highest values in front of the registers:
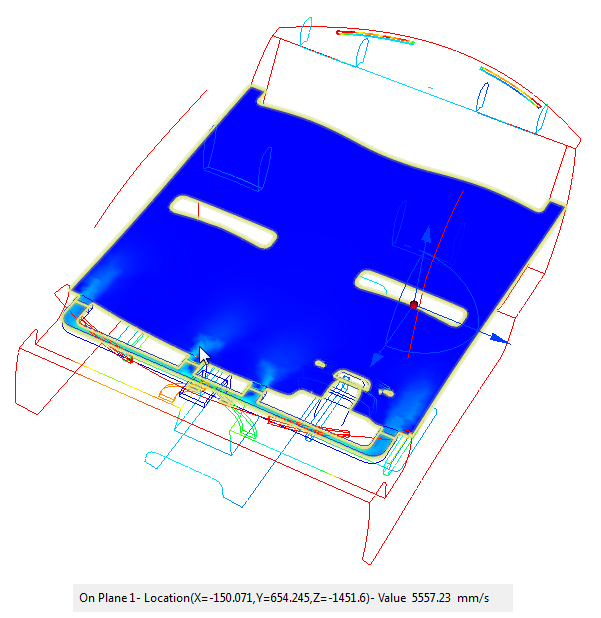
To view the velocity in greater detail: Right click on the Velocity Magnitude Legend, and choose Options. Check User specified range and enter 6000 for the Max value. Close the Legend Options dialog.
Note: Two legends are displayed. One is for Temperature, which is displayed on all 3D surfaces. The other is for Velocity Magnitude, which is displayed on the results plane.To show vectors, right click on the results plane and click Vector. Select Velocity Vector.
Right click on the results plane again, and select Outline.
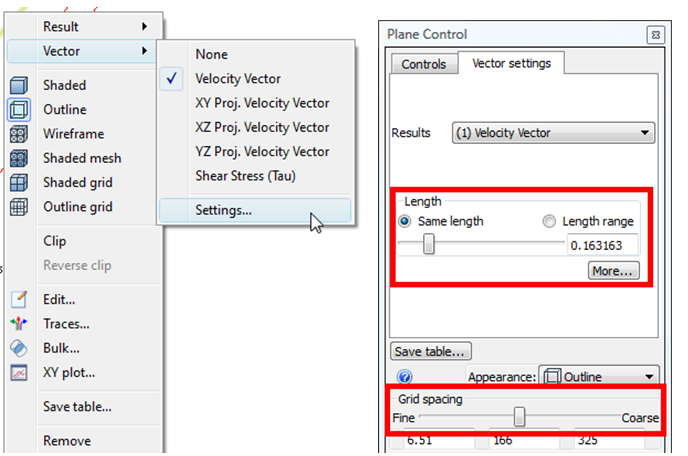
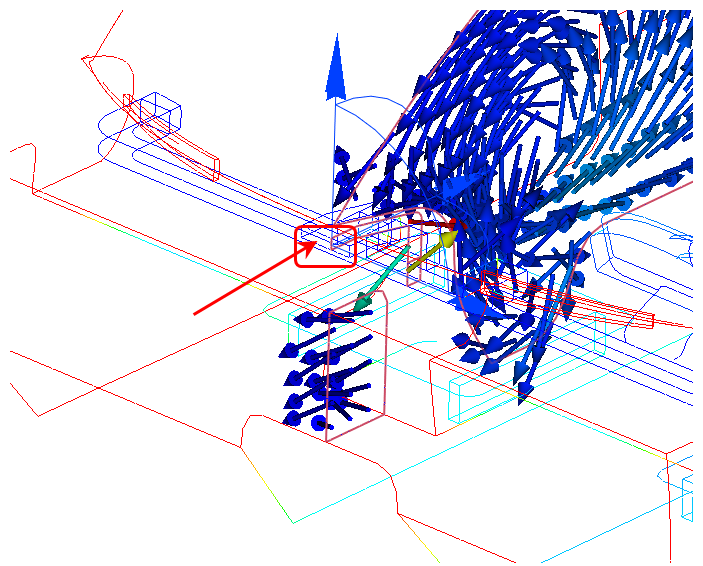
Right click on the plane, and click Vector, and Settings. Modify the vector length and spacing on the Vector settings tab of the Plane control dialog.
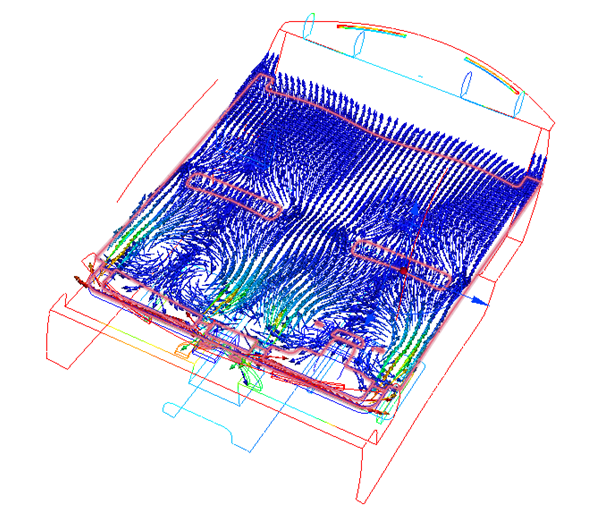
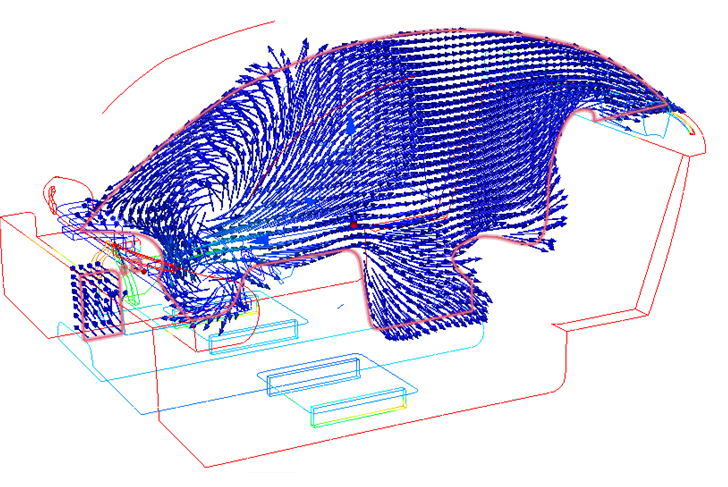
Note the flow distribution, including areas of recirculation near the front seats:
Left click on the results plane and select the X icon. Drag the plane to the center of the car:
 Note: Note the recirculation near the lower part of the windshield.
Right click on the results plane and select Clip.
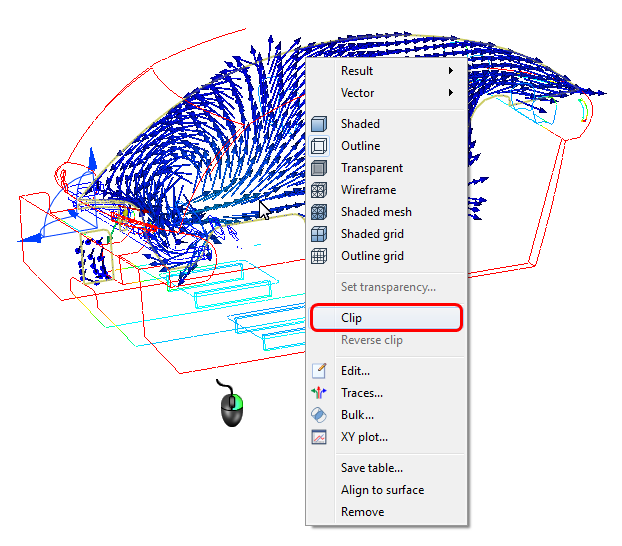
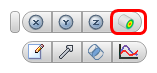
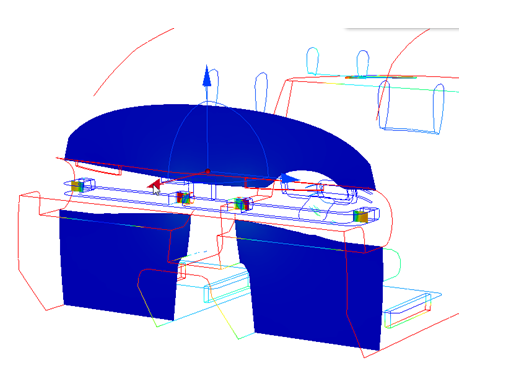
Select Shaded from the Quick Access toolbar:
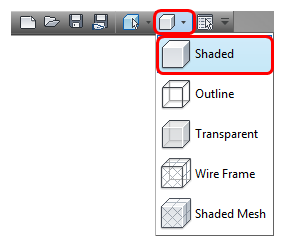
You should see this view. If you see the other side of the model, rotate it so you can see the results plane, right click on the plane, and click Reverse Clip.
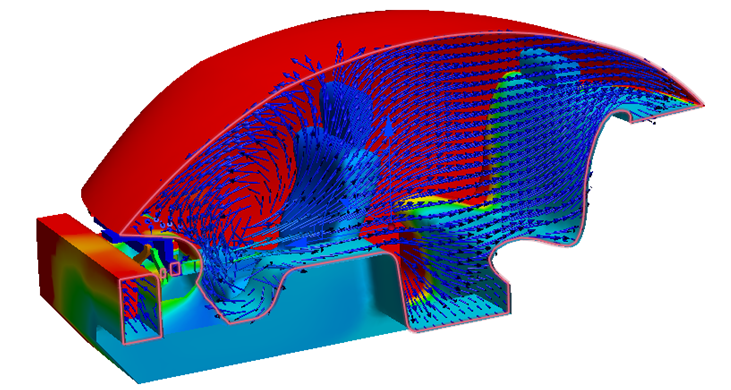 Note: Clipping improves visibility of specific model regions, and is a powerful way to display vectors when the model is shaded.
Right click on the plane and uncheck Clip.
Display the model as an outline by selecting Outline from the Quick Access toolbar.
To align the results plane to the inlet, left click on the results plane and click the Align to Surface icon.
Click on the inlet.
To hide the vectors, right click on the results plane and click Vector. Select None from the menu.
Bulk Data
Right click on the results plane and select Shaded.
Drag the normal axis of the cut plane triad to position the plane through the four front registers as shown:
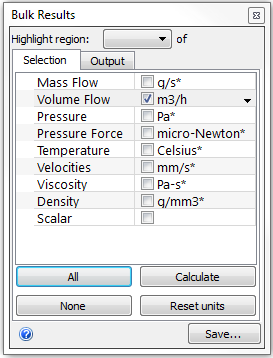
Compare the flow balance between the four registers: Select Bulk from the Planes context panel. Select Volume Flow. Click on the adjacent units field, and select m3/h.
Click Calculate.
Select regions from the Highlight region menu to identify the distinct registers.
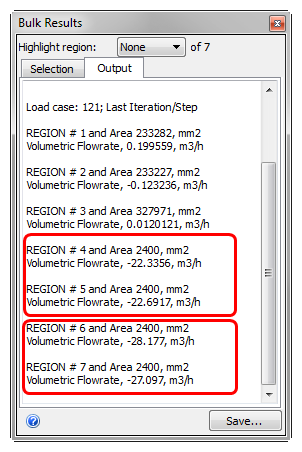
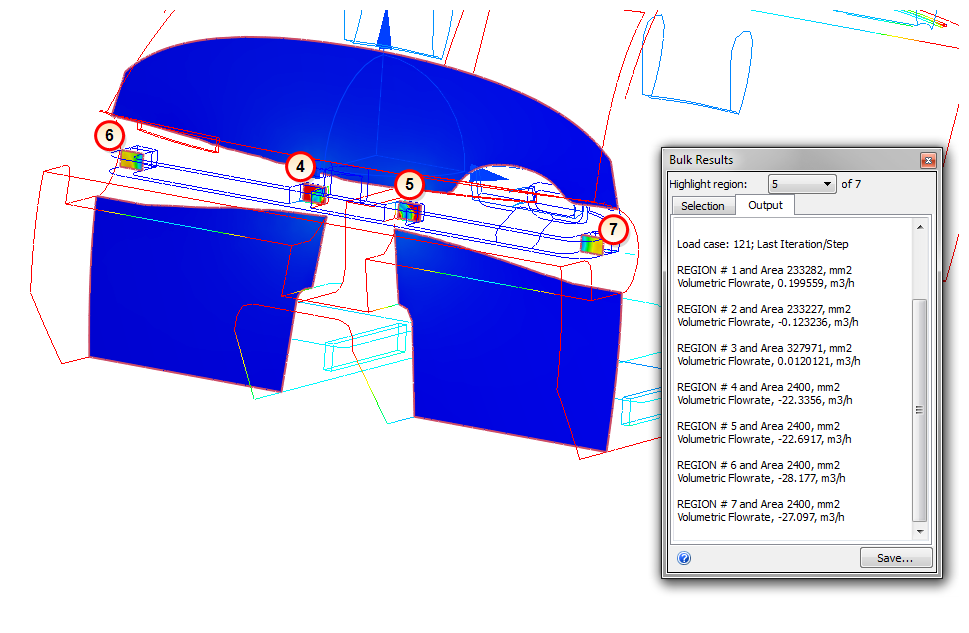 Note: This results plane is divided into 7 distinct regions. Autodesk® CFD numbers these regions. To highlight the corresponding region on the plane, select the corresponding number from the Highlight region menu. In the image, the regions are 4, 5, 6, and 7, but these numbers may differ for your model.
Observe the flow rates from all four registers. Note that the two interior registers (regions 2 and 3) each provide roughly 20 m3/h of air while the exterior registers (regions 6 and 7) each provide close to 30 m3/h.
To remove the existing results plane, right click on the plane and click Remove.