Exercise 8
Previous: Chapter 15 | Next: Exercise 9
This exercise teaches how to use results planes to understand your flow and heat transfer results.
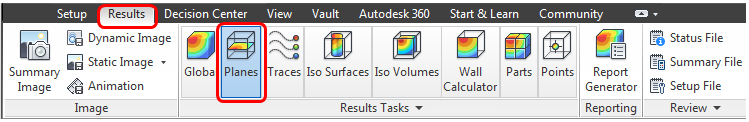
Select Planes from the Results tab:
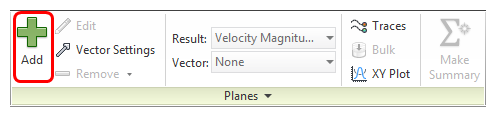
Create a Plane by clicking Add:
Results Overview
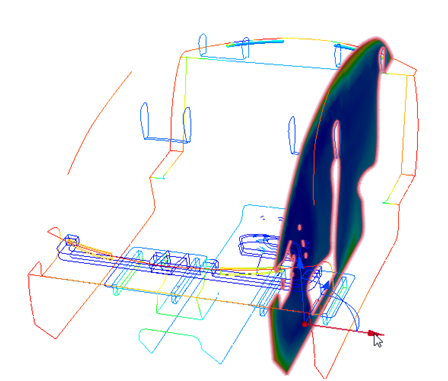
Move the results plane by dragging the mouse on the X-direction Triad arrow. Slowly sweep the plane across the model to view temperature distribution throughout the cabin.
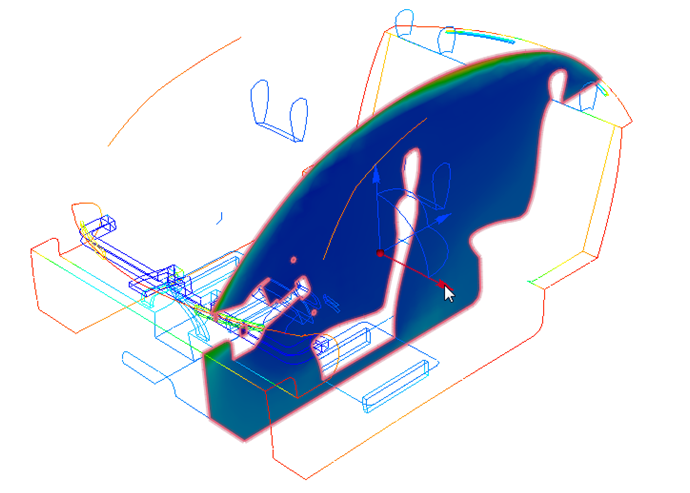 Note: The results you see may be slightly different from those presented here. This is due to differences in the mesh caused by variations in the different CAD model geometries.
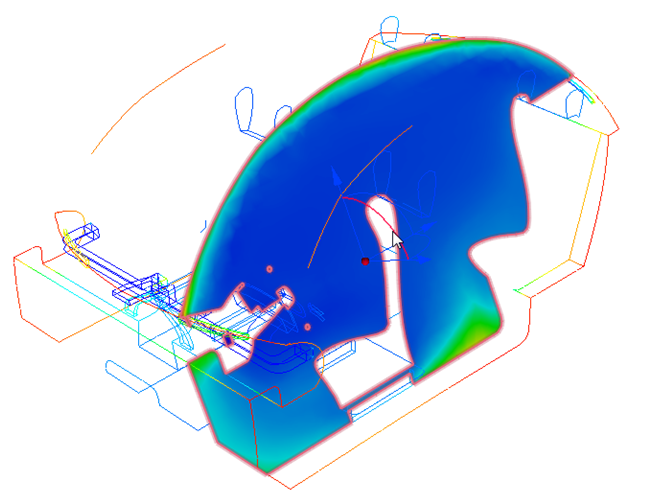
Rotate the results plane by dragging the mouse over the Triad arc shown below. Use this technique to study the temperature distribution throughout the cabin.
Snap the results plane to the vertical axis. Left click on the plane and select the Y icon.
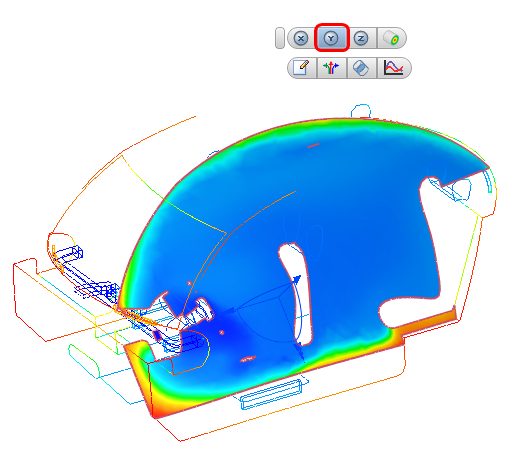
Move the results plane by dragging the mouse on the Y-direction Triad arrow.
Note: The highest temperatures occur near the bottom of the cabin.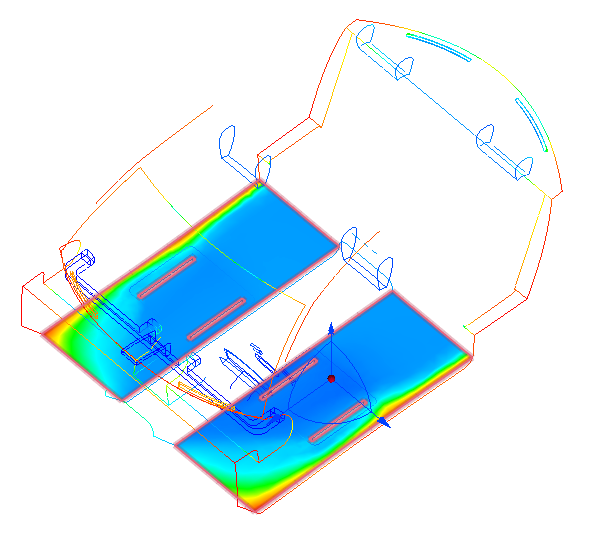
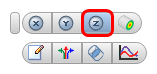
To align the results plane to the Z axis, left click on the plane and select the Z icon:
Drag the Triad arrow normal to the plane to view the temperature distribution throughout the cabin.
Note: The higher temperatures at the feet of the front and rear occupants. Also notice the slightly warmer region in the middle of the cabin.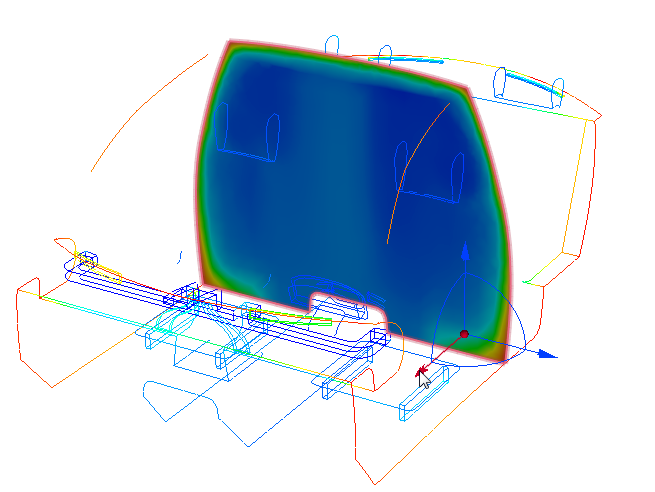 Note: The goals of this study are to determine if there is uniform cooling vertically within the cabin, and to assess the temperature variation between the front and rear sections of the cabin. Ideally, there should be little to no variation between the front and rear sections.
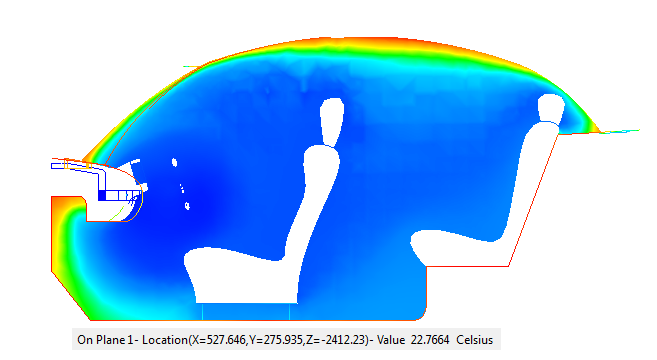
To measure temperatures of the front and rear occupants, position the plane normal to the x axis and through the front and rear seats. Left click on the results plane and click X on the toolbar. Drag the plane so it aligns with the outside flat surface of the headrests of both front and rear seats, as shown:
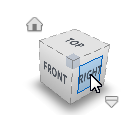
To align the view normal to the plane, click the Right face of the View Cube.
To measure the temperatures on the plane:
Probe by hovering the mouse pointer over the plane. Check the temperature values in the Status Bar at the lower left of the interface. Probe near the feet, knees, hips, and heads of both front and rear occupants.
 Note: If you have clicked outside the Autodesk® CFD interface, you should click anywhere within model display window to ensure probing is active.
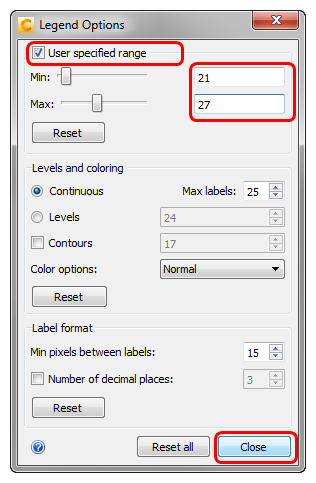
Highlight the temperature differences in this area by adjusting the legend range:
- Right click on the legend, and click Options
- Check User specified range.
- Set the Min and Max range by typing 21 and 27, respectively. Press the Enter key on the keyboard after each.
- Click Close to exit the dialog.
Occupant Temperature
Right click on the results plane, and select XY Plot.
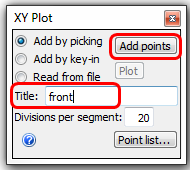
On the XY Plot dialog, enter “front” as the title and click Add points.
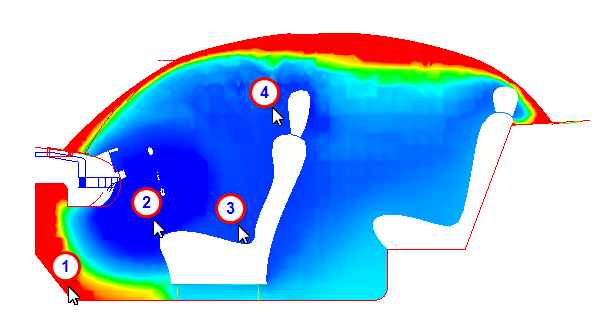
Select plot points by clicking on the results plane near the feet, knees, hips, and head of the front occupant:
Click Plot on the XY Plot dialog.
Click Show Points to hide the point symbols. Check the Summary box. Close the plot dialog after inspecting the results.
Note: You can also choose from other results to measure from the dropdown list in the top right of the plot window.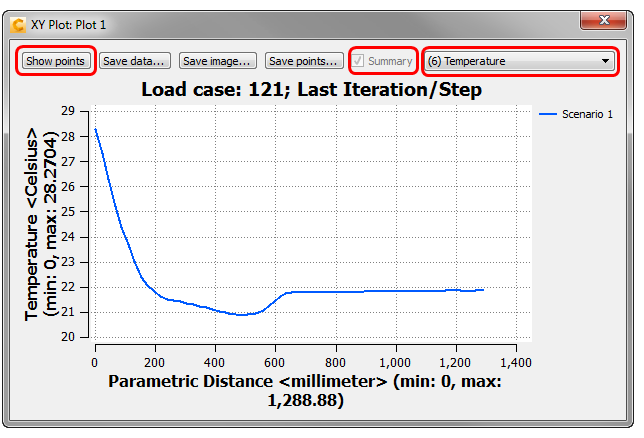 Note: The feet of the front occupant are approximately 7° C warmer than the rest of the occupant. This is information we will use to evaluate this model so we save it to the Decision Center by checking the Summary box.
To plot the temperatures experienced by the rear occupant, open the XY Plot dialog (if it is not already open). Assign the title “rear” to the XY Plot.
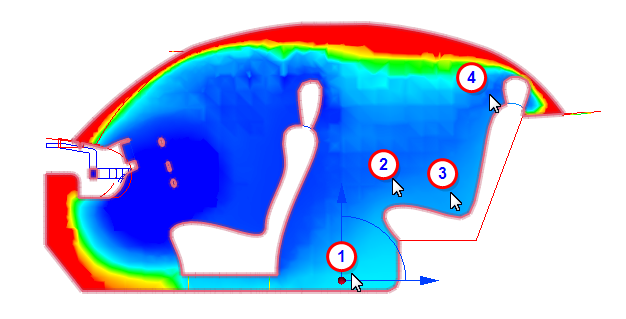
To select plot points, click Add Points on the XY Plot dialog, and click on the results plane near the feet, knees, hips, and head of the rear occupant:
Click Plot on the XY Plot dialog
Click Show Points to hide the point symbols. Check the Summary box. Close the plot dialog after inspecting the results.
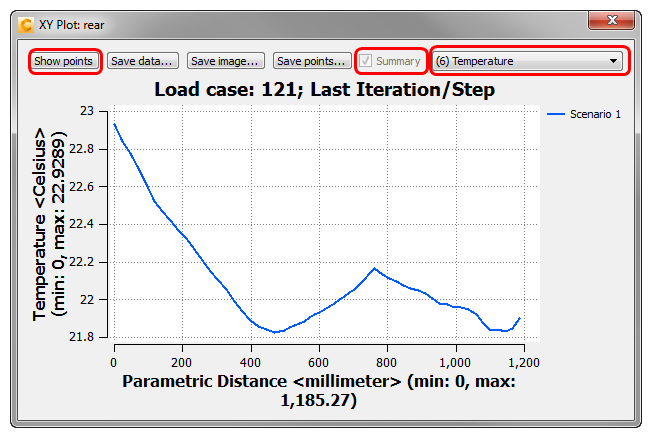 Note: The feet of the rear occupant are approximately 3° C warmer than the head of the occupant, and the hips and knees are also warmer than the head. This is information we will use to evaluate this model so we save it to the Decision Center by checking the Summary box.
To save this view for comparison later, right click off the model and select Capture summary image. (Alternatively, click Summary Image from the Results tab.)