Results Window
The Results window enables you to interactively review the identified clashes. It contains a list of all the clashes and several controls to manage them. For example, you can group clashes into folders and subfolders to simplify managing large numbers of related clashes.
 . Right-click this icon to rerun the test, or click Re-run Test at the top right of the window.
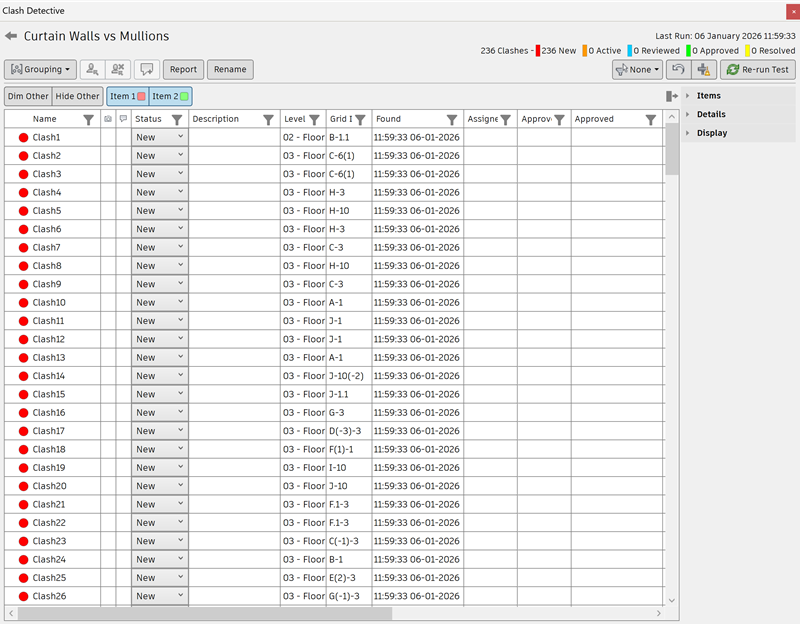
Results Area
The identified clashes are shown in a multi-column table. By default, clashes are numbered and sorted by severity. When you tab through the clashes using the arrow keys, a preview of each clash is displayed to enable you to locate clashes more easily.
Clashes with a saved viewpoint will display the camera  icon. Double-click on the camera icon to display a viewpoint thumbnail.
Sort and Filter Clash Results
You can sort and filter clash results, and manage the columns displayed as needed.
Click the Filter icon
 at the top of a column to display the sort and filter options.
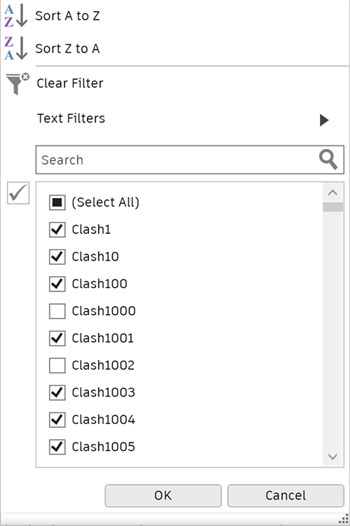
The options displayed will depend on the type of data in the selected column, and include text, number, and date filters.
Use the sort options to reorder the data in the column, either alphabetically or based on date.
Tip: You can also right-click a column and sort the contents into ascending or descending order.Search for specific clashes or groups, or use the available filters. For example, the text filters are as follows:
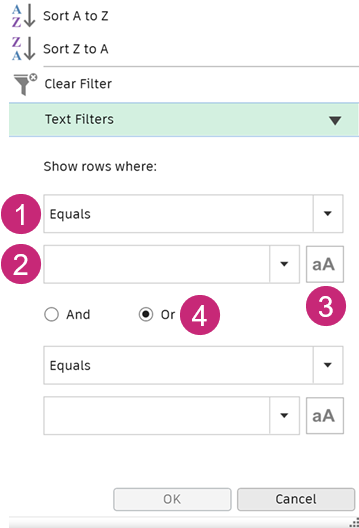
- Select a function from the drop-down list to specify how you want the clash results to be filtered in relation to your text entry or selection. For example, Equals, Begins with, or Contains.
- Enter text in the field, or use the drop-down list to choose a clash or clash group name.
- Specify whether the clash results should match the case you entered the text in.
- Select And or Or to add a second set of filters.
To choose which columns to display in the Results area, right-click on any column heading, click Choose Columns, and then use the check boxes to select and deselect columns. You can also use the Reset Columns option to return to the default settings.
Clash Status and Description
Each clash has a status associated with it, indicated by the icon displayed to the left of the clash name. Clash status is updated automatically by the Clash Detective each time the same test is run, but you can also update statuses yourself.
 icon. You can click the arrow next to a clash group to toggle between showing and hiding the clashes contained in the group.
 New - a clash found for the first time in the current run of the test.
 Active - a clash found in a previous run of the test and not resolved.
 Reviewed - a clash previously found and marked by someone as reviewed.
The Reviewed status could be used with the Assign feature. See Assign a Clash.
 Approved - a clash previously found and approved by someone.
If the status is manually changed to Approved, the current user is recorded as the approver, and the current system time is used as the time of approval.
If the test is run again, and the same clash is found, its status stays as Approved.
 Resolved - a clash found in a previous run of the test but not in the current run. The issue is, therefore, assumed to be resolved by changes to the design file and automatically updated to this status.
If the status is manually changed to Resolved, the current user is recorded as the resolver, and the current system date is used as the resolved date. If a new test finds the same clash, its status will be changed back to New.
The Description column is an editable field that you can use to add additional information about the clash alongside the specified status.
Results Area Buttons
Grouping
 :
:New Group
 - creates a new empty clash group. By default it’s called New Clash Group (x), where x is the latest available number.
Group Clashes
 - opens the Clash Grouping dialog, where you can specify the criteria you want to group clashes by.
Group Selected Clashes - groups all selected clashes. A new folder is added. By default it’s called New Clash Group (x), where x is the latest available number.
Remove from Group
 - removes the selected clashes from the clash group.
Explode Group
 - ungroups the selected group of clash results.
Delete Empty Groups
 - deletes clash groups that contain no clashes.
Assign
 - opens the Assign Clash Dialog Box.
Unassign
 - unassigns the selected clash group.
Add Comment
 - adds a comment to the selected group.
Report - opens the Report window, where you can set up and write reports containing details of all clash results found in the selected test.
Rename - renames the clashes. Use the Rename dialog to specify the following options:
- Selection - Rename all clashes, or only those filtered to or currently selected.
- Rename only Statuses - Select which statuses of clash to rename.
- Name Format - Use the buttons to select prespecified naming formats based on the clash details, and/or type in the field to manually rename the clashes.
Filter by Selection
 - shows only the clashes that involve the items currently selected in the Scene View or Selection Tree in the Results window. Choose from:
- None - turn off Filter by Selection.
- Exclusive - only clashes involving all of the currently selected items will be shown.
- Inclusive - only clashes involving at least one of the currently selected items will be shown.
Note: If a clash group does not contain any clashes involving the selected items, the whole group and its contents are hidden from view. Empty group folders always remain visible. If a group contains any clashes involving the selected items, the group (and all clashes in the group) remains visible. Individual clashes in the group that are not directly involved with selected item are displayed in italics.Reset
 - clears the test results leaving all other settings intact.
Compact
 - clears all resolved clashes from the current test. Resolved clashes within groups are deleted, but a group itself is only deleted when all the clashes it contains are resolved.
Re-run Test
 - re-runs the test and updates the results.
Context Menus
Right-clicking a clash in the Results window opens the following context menu:
- Copy Name - copies the value of the focused cell.
- Paste Name - pastes the copied value to the focused cell. This is disabled for read-only cells.
- Rename - renames the selected clash or group.
- Assign - opens the Assign Clash Dialog Box.
- Unassign - unassigns the selected clash or group
- Add Comment - adds a comment to the selected clash or group
- Group - groups all selected clashes. A new folder is added. By default it’s called New Clash Group (x), where x is the latest available number.
- Quick Filter By - filters the results grid to display only clashes with the selected criteria.
- Sort By Proximity - sorts clash results by their proximity to the selected clash. Clash groups are sorted by the group member that is closest to the selected clash.
- Viewpoint:
- Load Viewpoint - Loads the viewpoint for the current clash. Useful if you are in manual mode (Display Settings > Viewpoint > Manual), as the clash viewpoint will not be loaded in the Scene View, unless you use this option.
- Save Viewpoint - saves the current view as the viewpoint for this clash. Useful if you are in manual or auto-load mode (Display Settings > Viewpoint > Manual or Auto-Load), as the viewpoint will not be automatically updated to a new position as you navigate in the Scene View.
- Focus on Clash - resets the clash viewpoint so that it is focused on the original clash point, if the original point has been navigated away from.
- Delete Viewpoint - deletes the selected clash viewpoint.
- Delete all Viewpoints - deletes all clash viewpoints in the current clash test.
- Reset Columns - resets the column order to the default order.
Right-clicking a clash group opens the same context menu, but with the following additional options:
- Collapse/Expand - expands or collapses the clash group folders.
- Explode Group - ungroups the selected group of clash results.
Right-clicking a clash which is part of a clash group opens the same context menu, but with the following additional option:
- Remove from Group - removes the selected clashes from the clash group.
Items, Details, and Display options
Use the drop-down lists on the right to access items, details, and display panels.
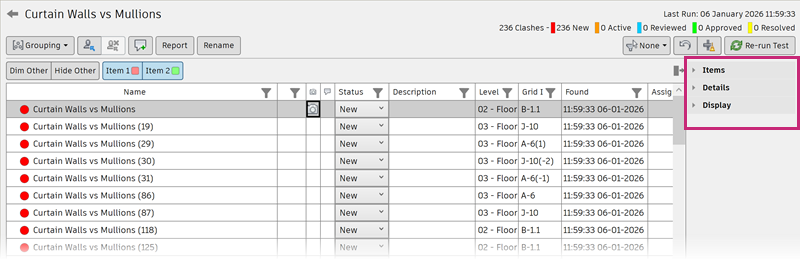
 to expand the panel.
Items
Click the Items drop-down list to show the Items panel, which contains data regarding both of the items in the selected clash. This includes the Quick Properties relating to each item and also the path through the standard Selection Tree from the root to the geometry of the item.
 Highlight Item 1/Item 2 - Toggles the highlighting of the item in the view.
 Group Clashes Involving Item - creates a clash group containing all clashes involved with the item or items that you have right-clicked on.
 SwitchBack - select an item in the Items panel and then click this button to allow the current view and currently selected object to be sent back to the originating CAD package (AutoCAD, Revit 2012, and Microstation-based applications only).Note: When multiple items are selected on the tree, this button is not available.
 Select - selects the items in the Scene View, replacing any current selection. Selecting an item in the Items panel area, and then clicking this button selects a clashing item in the Scene View and in the Selection Tree.
Details
Click the Details drop-down list to show the Details panel, which displays a summary of the details from the Results table for the selected clash. This includes the clash name, the number of associated comments, the clash status, and information about the clash itself such as level, grid intersection, and clash point.
Display
Click the Display drop-down list to show the Display panel, then use the following options to enable efficient clash review:
Highlighting
Item 1/Item 2 buttons - click the Item 1 and / or Item 2 buttons to override the color of the item in the Scene View.
Use item colors / Use status color - highlight clashes using the specific item color or status color of the selected clash. To change these colors, go to the Options Editor dialog box > Tools > Clash Detective > Custom Highlight Colors > Item colors option.
Highlight all clashes - select this check box to highlight all found clashes in the Scene View.
Note: The clashes shown depend on which Item 1 and Item 2 buttons are selected; if only the Item 1 button is selected then only "items 1's" involved in clashes will be shown, if both buttons are selected then all clashes will be shown.
Isolation
Dim Other/Hide Other buttons - select Dim Other to turn all items that are not involved in the selected clash or selected clash group to gray. This makes it easier to see the clashed items. Select Hide Other to hide all other items except for all those involved in the selected clash or selected clash group. This enables you to focus better on the clashing items.
Transparent dimming - this check box is only available when you select the Dim Other from the Isolation drop-down list. Select this check box to render all items that are not involved in the clash transparent, as well as gray. You can use the Options Editor to customize the level of dimming transparency, and to select to display items not involved in the clash as wireframes. By default, 85% transparency is used.
Auto reveal - for an individual clash, selecting this check box temporarily hides anything obstructing the clashing items so that you can see the selected clash when zooming in on it, without having to move location.
For a clash group, selecting this check box automatically shows the most severe clash point in the group in the Scene View.
Viewpoint
Auto-update/Auto-load/Manual:
Auto-update - navigating away from the default viewpoint for a clash in the Scene View will update the viewpoint for the clash to the new position and a new viewpoint thumbnail will be created in the Results grid. Use this option to enable Navisworks to automatically choose an appropriate viewpoint or load a saved viewpoint, and save any subsequent changes you make.
Note: Selecting Focus on Clash always returns to the clashes original default viewpoint.Auto-load - automatically zooms the camera to show all items involved in the selected clash or selected clash group. Use this option if you want Navisworks to automatically load a saved viewpoint but do not want to save viewpoint changes automatically. You can use the viewpoint context menu, for example, to save viewpoints.
Manual - the view of the model does not move to the clash viewpoint when you select a clash in the Results grid. Using this option allows you to keep the main viewpoint static while flicking through the clashes one by one. You can use the viewpoint context menu, for example, to load viewpoints.
Animate transitions - selecting this option animates the transitions between clash points in the Scene View when you select clashes in the Results grid. Clearing this option allows you to keep the main viewpoint static while flicking through the clashes one by one. By default, this check box is clear.
Tip: To benefit from this effect you must select the Auto-Update or the Auto-Load viewpoint option.Lock pivot to clash - selecting this option locks the pivot point to the clash. This is useful for maintaining focus on the clash even if you use other navigational tools such as zoom.
Focus on Clash - resets the clash viewpoint so that it is focused on the original clash point, if the original point has been navigated away from.
Simulation
- Show simulation - select this check box to use time-based and soft (animation) clashing. It moves the playback slider in the TimeLiner sequence or an animation scene to the exact point at which the clash occurs, and enables you to investigate the events happening immediately before and after the clash. For clash groups, the playback slider is moved to the point in time of the ‘worst’ clash from the group. See To Review Time-Based Soft Clash Results, for example.
View in Context
The options in this list enable you to temporarily zoom out to a point of reference in the model, giving context to the clash location. Choose one of the following options:
- All - the view zooms out to make the whole scene visible in the Scene View.
- File - the view zooms out (using an animated transition) such that the extents of the files containing the items involved in the selected clash are visible in the Scene View.
- Home - takes you to the previously defined Home View.
View - press and hold the View button to show the chosen context view in the Scene View.