Analyze Cross-Project Risk
Account administrators and users with an executive role, such as the VP of Operations, have access to the Risk tab. The Risk tab can help you to analyze risk across all of your projects. The Risk tab includes data such as:
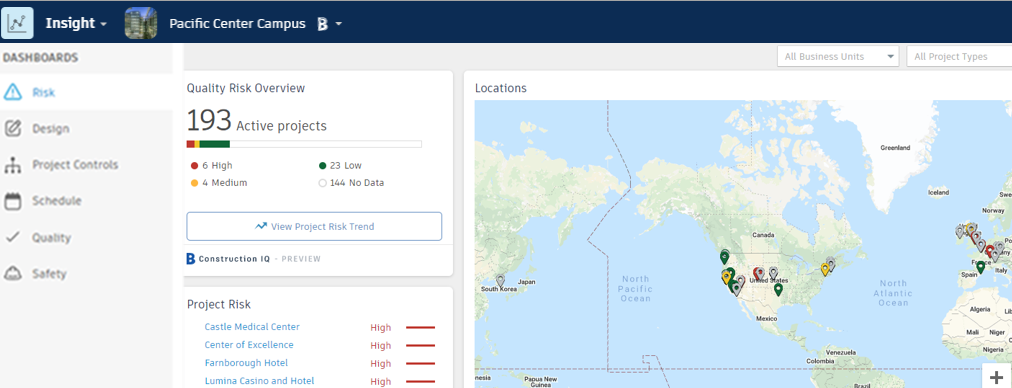
A Quality Risk Overview and High Risk Quality Issues chart based on data from your projects that are using BIM 360 Field.
The overview shows a summary of the total number of active projects, and the proportion of those projects marked as high, medium, and low risk. The chart shows a summary of all high risk issues across all projects, and a trend line, so you can assess whether the number of high risk issues are increasing or decreasing overall.
The chart also breaks the data down to show the current numbers and trend lines for particular risk categories including water issues; a specific type of high risk issue that typically creates more downstream risk.
The geographical locations of all projects across the account. Projects are color-coded by risk level, with red being highest, and green the lowest.
Tip: Projects are positioned on the map based on the specified project address in the Project Admin module Profile tab. If a project is missing from the map view, it’s likely that the project profile does not have a complete address. Ask your account or project administrator to include addresses for each project.
A list of all the projects in order of their identified level of risk each day. This can inversely be used as a leaderboard of the projects that currently have the lowest level of risk.
A project's risk level doesn't indicate whether it's well managed; instead it indicates that the project has a higher than normal risk on that day, and you probably want it on your radar. A large, complex project will often (but not always) show a higher level of risk than a smaller project.
Risk levels provide guidance on where to focus. Select any project from the list to drill down and review the risk details for that project, including information about subcontractor risk.
Tip: Gray colored projects are those that are not yet using BIM 360 Field or don’t yet have a significant amount of Field data.
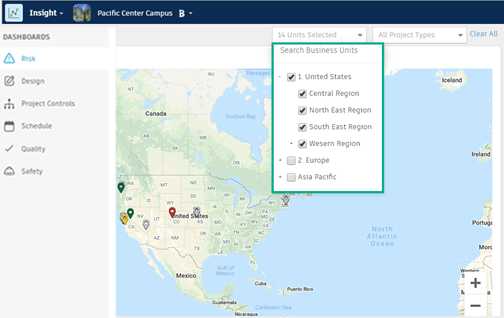
You can use the business unit or project type filters to refine the data viewed on the Risk tab.