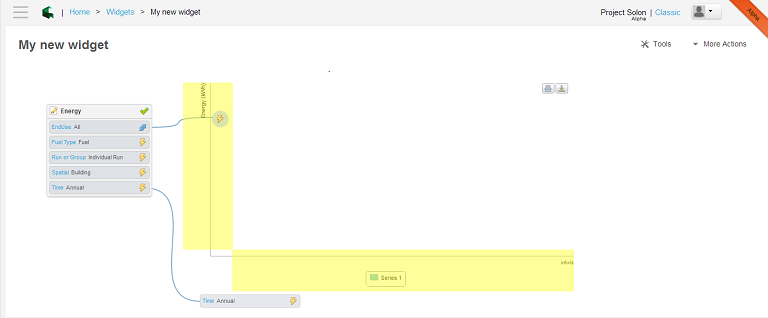
The widget editor is the environment where you define your widget by editing which result types(s) and which chart type you wish to review. After creating a new widget you will be automatically taken to the widget editor.
-
Result Types
Results Types are all of the categories of energy analysis results available for you to review more closely and with different ways of slicing the data. For example the “Energy” results type allows you to configure which energy end uses you wish to view and which time period you’d like use, such as annual or monthly results.
-
Adding result types
From the top right of the page select Tools. Select “Result Types.” Grab the result type(s) and select the chart types you wish to review and drag onto the Widget editor canvas.
You can modify the name of the chart type and result type by clicking on the pencil icon. You can expand and collapse the Result Type window by double clicking on the name.
The available groupings associated with the chosen result type are automatically shown. To define what group of data you want, you need to define each one of these slices. When you’ve defined all of these slices, you will see a green checkmark indicating the data has been found and you can start adding it to a widget.
-
Assigning Result Type properties to the chart
To assign the specified result type(s) to a chart, you can select any grouping with a yellow flash sign beside it and drag it to either the Category or the Series area of the chart. You must select an option from each of the Result Type groupings before the data is available.

-
Editing Result type property assignments
You can change the chart type at any time from the chart type list, and you can modify the Result Type slices any time from the Grouping selections. To unhook the parameters from the graph double click on the blue hook sign. You can drag the result type that you do not need any more to the trash can at the top center of the canvas.
When you have completed modifying the widget, you need to publish it before you can use it in a dashboard.
-
Adding/Deleting/Selecting Run Data
When you first use Project Solon, data from a sample project (Autodesk Benchtop Commercial Office Project) energy analysis run is automatically associated with sample widgets and any new widgets you may create. You can connect your project and runs from Revit and GBS Classic to widgets.
Within the Widget Editor, click on “More Actions,” choose “Test Environment.” This will open a window showing recent project runs used in your widgets. The current run data being used will be highlighted. If you wish to choose a different run from the current list in the window simple click on it and the widget will refresh with the new project run data. To choose a run not shown in the Test Environment list, click “Add” from the bottom of the list, click on the project name, a list of all of the base runs for that project will appear in the right side of the table. Click the base run name and then click “Add.” The project and base run will now appear in the Test Environment window, click on the Project you wish to review from the list and the widget will refresh with the data.
You can delete the project names from the Test Environment window by mousing over the project name and clicking on the “x.”
-
Selecting charts to match your data / How identify what kind of chart best communicates the information I’m trying to model
Content too come soon!!!!!