Good climate data is a critical input for valid building performance analysis. The Autodesk Climate Server provides easy access to a large database of climate and weather data within Autodesk Green Building Studio, Revit, and Vasari.
Weather can vary greatly from site-to-site, even within a relatively small geographical area. Most weather data comes from physical weather stations, which are situated at large airports and may not represent the weather at your building. Getting more locally appropriate weather data can help improve the accuracy of your energy analysis results.
Autodesk’s Climate Server has 1.6 million virtual weather stations based on meteorological simulations. This means that you can usually find useful weather data less than 14km away from a building site almost anywhere in the world.
How much does weather data matter to energy simulation results?
Energy simulation results are only as good as the underlying model. This includes both the building geometry and the environmental conditions like weather.
Your building’s climate and its design will determine the weather variables that your energy model will be the most sensitive to. For example, if your building has a lot of glazing and is in a sunny climate, solar radiation is likely to be a dominating factor. Generally, to get good simulation results for HVAC systems, you’ll need accurate data on drybulb temperature and dew-point temperature.
Also, because cooling can be so much more thermodynamically efficient than heating, changes to weather conditions have less of an impact on energy use results in cooling-dominated locations (such as Los Angeles) than in heating dominated locations (like Copenhagen). So you need to be extra careful about your weather data in cold climates.
Lastly, if your weather data is generally correct and consistently applied, it should be sufficient for early comparative design studies.
Are Climate Data and Weather Data different - and when to use each?
Climate data is based on historical averages, usually over a period of record (PoR) of 30 years. Climate data is most useful for predictive whole building energy simulations because it represents typical conditions. That said, typical years may not be a good indicator of the conditions over a given year or of a changing climate. It does not represent extreme conditions (i.e. abnormally hot or dry).
Weather data is from a specific day and time. Within an existing building context, it can allow you to simulate a specific year and compare the results to actual energy use. This is useful for creating a calibrated energy model for “as-built” buildings. This data can also be used for predictive building energy simulations, with the caveat that it is more appropriate early, comparative analysis when you’re trying to understand how energy use responds to different design options. It is not meant for HVAC sizing, for example. For comparative analysis, the benefit of the close proximity of the data to the building site can outweigh the fact that it is for a single year, and not based on long-term climate observations.
Where is data available?
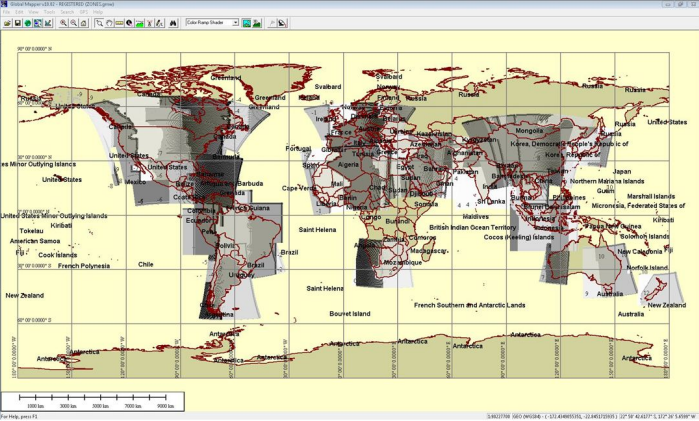
There are virtual weather stations available for most of the world. Exceptions include parts of central Africa, central Australia, Russia, and extreme latitudes near the poles. Learn more about the sources of this data in the Data Sources article.