This section describes how to use the Project Weather Station tab.
In the weather Station tab you can review weather data results, multiple weather station data sets, and download weather data files.
The weather station's Energy Code Climate Zone is also displayed. Climate Zones are defined by the 2009 International Energy Conservation Code, Table 402.1.1. For more information, see Climate Zones.
The Weather Summary tab displays the available weather data charts. For specific charts, go to the corresponding tab, either Weather Frequency, Wind Roses, or Design Conditions. The Weather Summary includes the following charts.
-
Cooling Degree Day
-
Heating Degree Day
-
Annual Design Conditions
-
Monthly Design Data
-
Dry Bulb Frequency Distribution
-
Dry Bulb Cumulative Distribution
-
Wind Rose charts (annual and monthly)
-
Wind Speed Frequency Distribution
-
Dew Point Frequency Distribution
-
Relative Humidity Frequency Distribution
-
Total Sky Cover Frequency Distribution
-
Direct Normal Radiation Frequency Distribution
-
Diffuse Horizontal Radiation Frequency Distribution
-
Global Horizontal Radiation Frequency
To view the weather station
-
Click Weather Summary tab.
-
Click the Weather Station link, or click
 View Weather Station. In the View Weather Station dialog, the specified weather station displays.
In addition to the station location information, you can review the following data:
-
Cooling Design Conditions
-
Cooling Degree Day
-
Heating Design Conditions
-
Heating Degree Day.
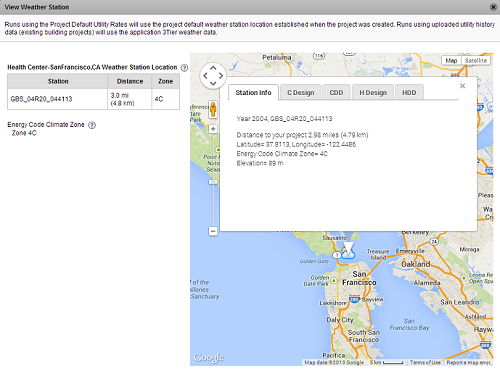
Runs using the Project Default Utility Rates use the project default weather station location that was established when the project was created. Runs that were created using utility history data for existing building projects use 3TIER weather data.
-
To use the weather variable tool
-
Click Weather Frequency tab.
-
Specify the unit of measurement (IP or SI).
-
Specify the Weather Variable. The options are:
-
Dry Bulb
-
Dew Point
-
Relative Humidity
-
Wind Speed
-
Sky Cover
-
Direct Normal Radiation
-
Diffuse Horizontal Radiation
-
Global Horizontal Radiation
-
-
Specify the Season, Starting Hour, and Duration.
-
Click Get Data.
To use the wind rose tool
-
Click Wind Roses tab.
-
Specify the unit of measurement (IP or SI), the Season, Starting Hour, and Duration.
-
Click Get Data.
The chart displays the calculated data.
To use the monthly design data tool
The Monthly Design Data chart displays the average daily minimum and average daily maximum dry-bulb temperatures for each month.
-
Click Design Conditions tab.
-
Specify unit of measurement (IP or SI), and the percentage threshold.
The chart displays the calculated data.
To download weather data
-
Click Weather Station tab.
-
Click Download Weather data.
-
Select the file format, either CSV or BIN (DOE-2 binary).
-
In the File Download dialog, click Save and specify the save location.
To learn more see Weather Data in Green Building Studio.