The Autodesk Climate Server is a distribution channel that aggregates and delivers climate and weather data from several sources, using several methodologies:
-
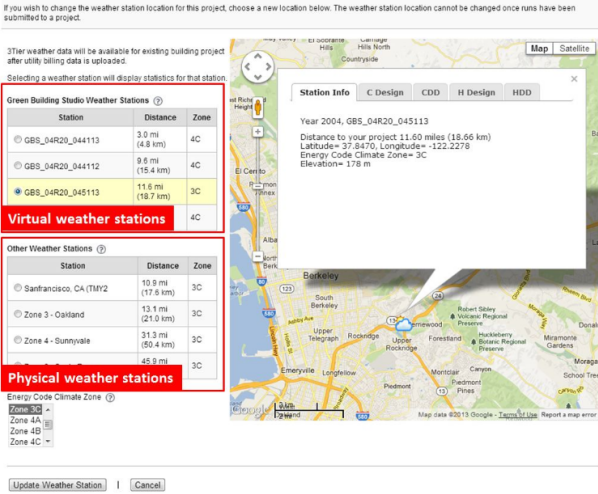
Virtual weather stations ("Green Building Studio weather stations" - 1.6 million stations)
Autodesk Climate Server includes about 1.6 million virtual weather stations based on numerical meteorological simulations. It was created to allow more accurate simulations in places where there isn't a physical weather station.
This data comes from simulations of specific years (2004 and 2006). Unlike the TMY2 data, no effort has been made to select data to be more characteristic of the climate. As a result, this is not climate data and any extremes or anomalies that occurred in that year are reflected in the data.
To know what year the data comes from, look at the name of the virtual weather station: if it is "GBS_04" it is from 2004, for example.
Even so, this data may be more appropriate for building sites than the closest physical weather station, especially in areas of significant terrain and elevation variability and when the building or TMY station are near significant bodies of water.
How the simulations work:
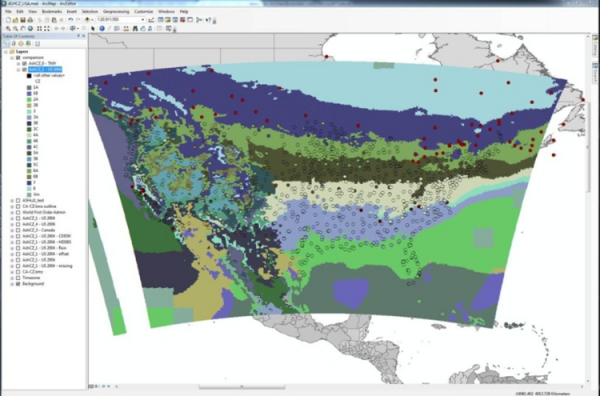
The data at virtual weather stations come from a numerical weather prediction (NWP) model that is based on the physics of the atmosphere and projects the weather variables of interest. An analysis area of several hundred square kilometers is broken-up into a grid of 10 and 20 square kilometer segments - and the simulation is run within each square of that grid. The resulting virtual weather station is located at the center of each grid square.
The simulations are initialized with meteorological data assimilated from a variety of sources, including: surface reporting stations and buoys, commercial aircraft, wind profilers, rawinsondes, dropwinsondes, Radio Acoustic Sounding System (RASS), Velocity-Azimuth Display (VAD) winds from Doppler radar, GOES, GPS, and SSM/I satellite data.
The weather prediction models used exhibit high skill at forecasting weather in the first 48 hours of the simulation period. As the length of the simulation grows, minute differences between reality and the initial model conditions are magnified and compounded upon. After 48-hours of simulation, the data is added to record that will become the data file for the year, and the model is re-initialized with a fresh set of assimilated observations.
The specific models that were used to create the Green Building Studio Weather Stations are: Rapid Update Cycle (RUC) and Mesoscale Meteorological Model version 5 (MM5). RUC was used for most of the data (2004 dataset), but there were some gaps in the data. The MM5 simulations were then used to fill those gaps (2006 dataset).
Why is there a weather station in the ocean with a non-zero elevation?
Because the climate simulations are done on a grid, the elevations are averaged within that grid. Near the coast, the center of the analysis square might be in the water - and sometimes you see the effects of an elevated land mass on the coast.
Note: This data is labeled as "2004/2006" within Autodesk Vasari and Revit.See this whitepaper for more information, and a validation study that was done in 2008.
-
Physical weather stations ("other weather stations" - about 1,800 stations)
Autodesk Climate Server includes about 1,800 stations with TMY2 data. This data comes from measured values at weather stations, which are often either at airports or maintained by other groups.
The National Climatic Data Center (NCDC) also maintains databases of TMY data.
While this data comes from TMY2 data, the output of GBS is not in the TMY2 format. It is different than the fixed length record format that NREL distributes. GBS drops the non-metrological meta data (source and uncertainty flags) and converts the units.
Note: This data is labeled as "2010" within Autodesk Vasari and Revit, although it does not correlate to that specific year because it is climate data. It includes data from 12 different years of data (selected from the past 30 years). -
Historical data (3-Tier3)
3-Tier data is simulated data from the last 10-20 years. This reanalysis data is generated by the Weather Research and Forecasting (WRF) model. It is simulated in a similar way to the virtual weather stations described above. The WRF model is a newer generation methodology than the RUC & MM5 data that the other virtual weather stations use.
Just like other numerical weather prediction models, WRF outputs weather variables computed at distinct grid points. However, the data from 3-Tier is spatially interpolated to provide data at the specific location of the building being simulated.
This data allows you to look back in time and calibrate an "as-built" energy model of an existing building. This can help with energy efficiency measures and operations & maintenance.
3-Tier data currently cannot be downloaded, and can't be accessed for general predictive analysis. It can be accessed if you upload utility data through GBS to analyze and calibrate an existing building model.