Analyze Model Analytics Metrics
Model Analytics helps project teams and executives assess the health and quality of models across projects. By surfacing key model metrics in the Insight tool, project leaders can identify problem areas, track improvement over time, and take action before model issues affect downstream workflows.
Prerequisites
To use Model Analytics, make sure:
Revit Desktop is installed
The Revit Model Analytics add-in is installed.
Learn more here.
Analyzing Model Analytics Metrics
Model Analytics data is displayed in the Model Analytics feature in the Insight tool.
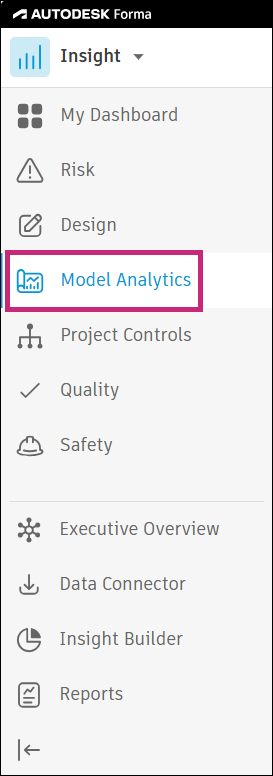
From the product picker, click Insight.
Click Model Analytics from the left panel.
Review the cards to assess model health across your projects:
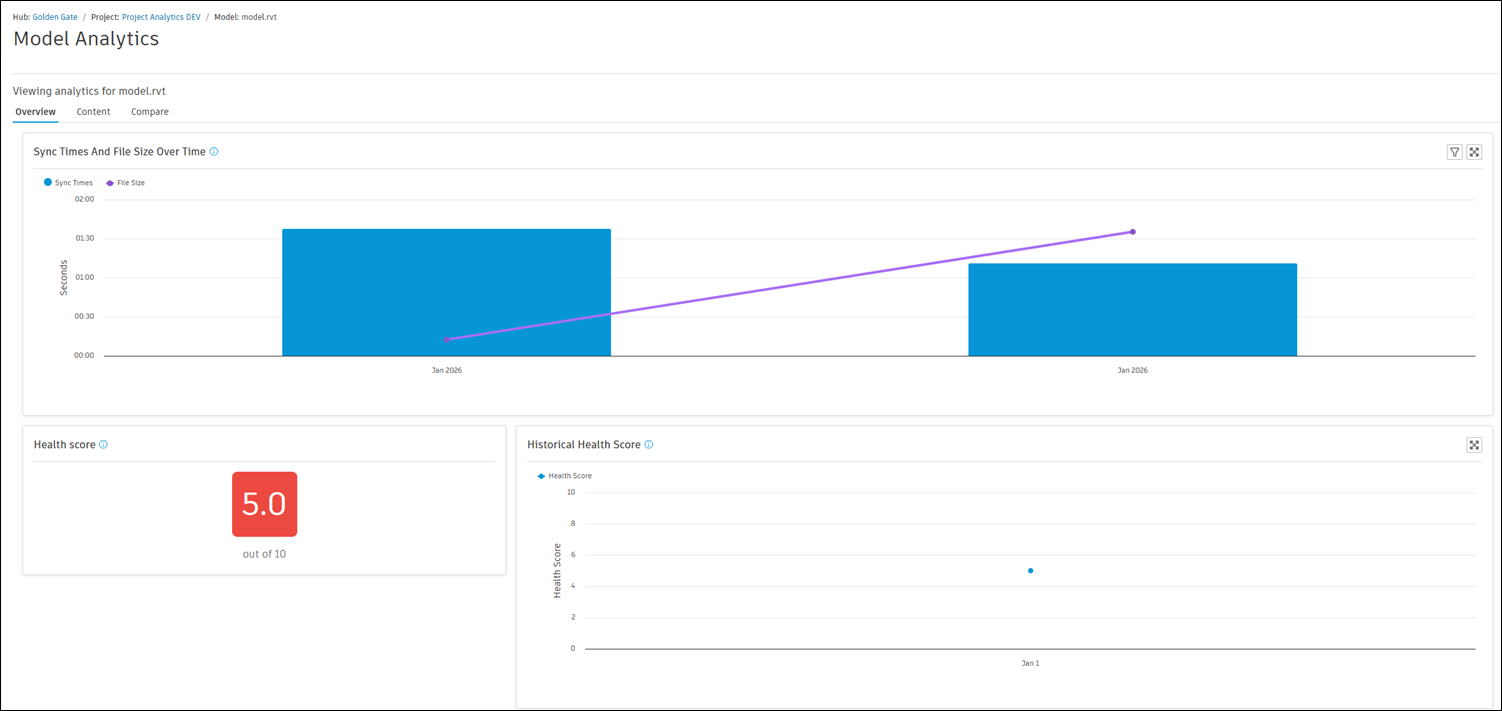
- Sync Times And File Size Over Time: A visual representation of trends in sync times and file sizes for all models in the project over time to help identify potential performance issues with models.
- Available Models: A table view of available models and their sync times. Click on a model name to open its details.
- Health score: A score calculated by evaluating multiple model health indicators such as critical and non-critical Revit warnings, Revit links, CAD/import links, in-place families, plan regions, and image imports.
- Historical Health Score: A visual representation of the cumulative health score trend across all models in the project over time to help identify improvements or declines in model health.
- Health Indicators: A summary of indicators for tracked projects together with status information for each indicator.
Indicators include:
- Revit links
- CAD links
- CAD imports
- Imported images
- Sync times (in seconds)
- In-place families
- Plan regions
- Non-critical and critical Revit warnings
- Revit warnings: A summary of Revit warnings for tracked projects with timestamp information for each warning.
Click any card to drill down into the underlying model data and review specific details contributing to the metrics. For example, click
 in a Health Indicators card to drill down to detailed model data for that specific indicator. The dashbaord that opens is made up of three tabs:
Overview: Provides insight into sync times and file size over time, health score, and historical health score, health indicators, and Revit warnings for the selected model.
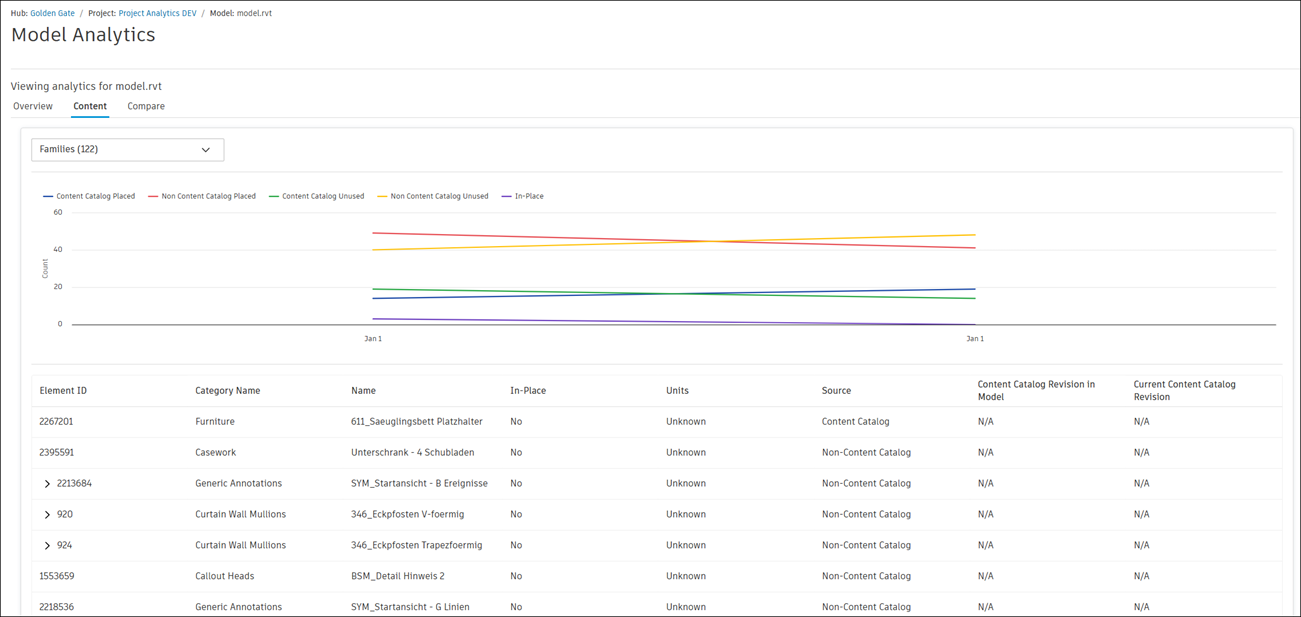
Content: Allows you to select desired content type from the drop-down menu to review detailed data for that content type.
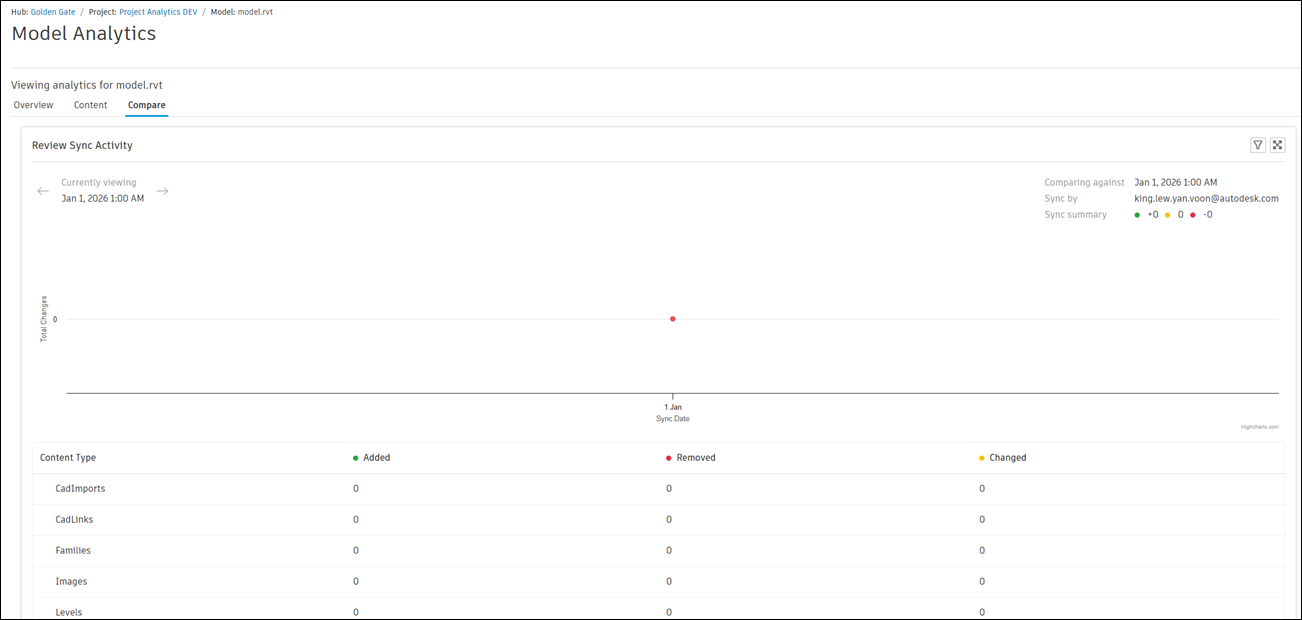
Compare: Shows review sync activity for each content type.
 Tip: Review Model Analytics data regularly as part of your model coordination workflow to catch quality issues early and reduce rework downstream.Note: Model Analytics only displays data for projects with supported model data available. Hub-level Model Analytics data is available to members with executive overview access in the Model Analytics in Insight.