With the Results panel, you can view your results to understand how the flow moves over and around your model.
Note that for 2D simulations, changing the position or orientation of the plane causes the calculation to start over.
Result Quantity
Select the displayed output quantity.
- For 2D and 3D simulations, you can display Velocity or Pressure:
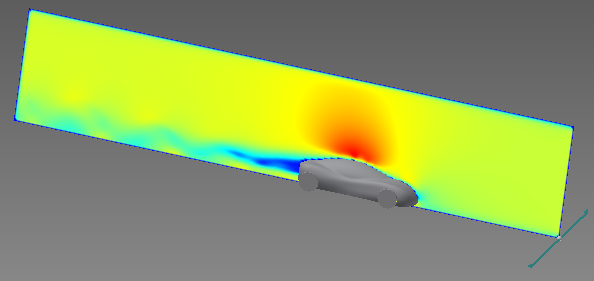

- For 3D simulations, you can also display pressure on the object by clicking Surface Pressure:
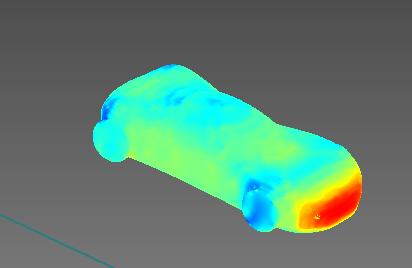
This is useful for understanding where the wind imparts the highest and lowest pressures on the surfaces of the object. It provides useful information about the aerodynamic performance of the model.
- You can also plot the Drag for 3D simulations:

Ways to display results
There are several ways to view your simulation results. Each shows the flow detail in a slightly different manner, so it is good to experiment with the different types to find the one that works best with your specific model.
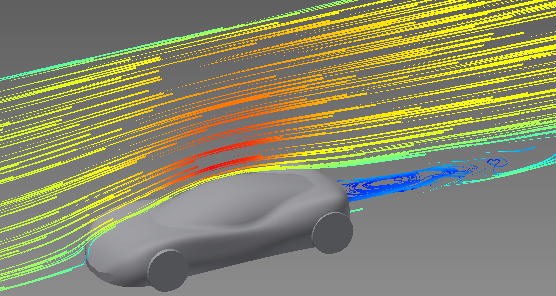
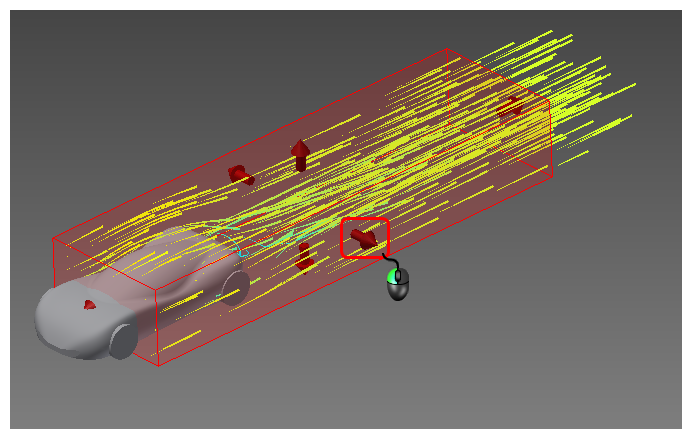
- Flow Lines: Traces that show the path of a flow particle as it moves through the wind tunnel. These are very useful for visualizing flow direction and circulation. In 2D analyses, flow lines appear on the 2D slice. In 3D analyses, flow lines appear throughout the wind tunnel.
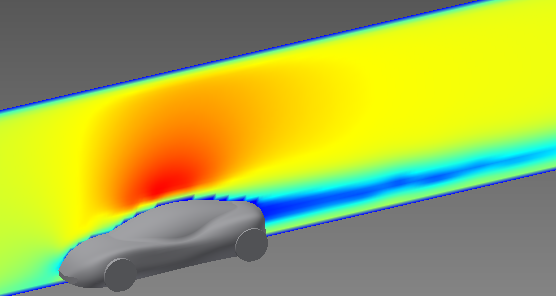
- Shaded: Opaque 2D slice through the model. Note that this is available for both 2D and 3D simulations:
- Vectors: Arrows that show wind direction and are colored by velocity.

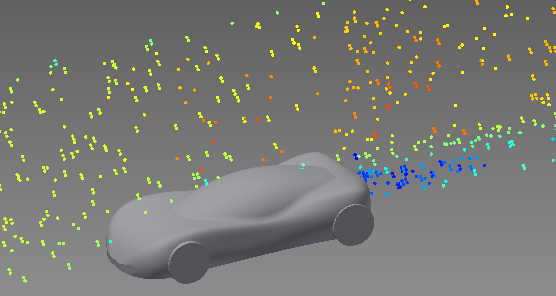
- Particles: View the flow as solid spheres that move in the same way as flow lines.
Flow Line Settings
Control the appearance of flow lines with the Flow Line settings. Click here for examples of each setting.
- Seed Box: Use the seed box to focus flow lines on a particular region of the model. This is useful for improving visibility of a specific part of the model by removing flow lines from outer areas of the flow domain. To change the seed box size, use the grab handles to drag the box to the desired dimensions.
Plane Orientation
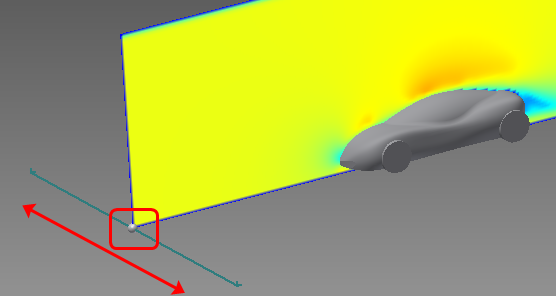
Change the orientation of the plane by selecting one of the orientations: Front (XY), Side (YZ), or Top (ZX).
Note that you can interactively control the position of the plane with the drag handle on the plane:
Units
Set the units of the displayed results:
- US: The length unit is feet, and velocity is displayed in units of ft/s.
- SI: The length unit is meter, and velocity is displayed in units of m/s.
Color Schemes
Select the visualization legend color scheme from the options in the expanding menu. The default is Standard. You can view examples of color schemes here.