Stress View
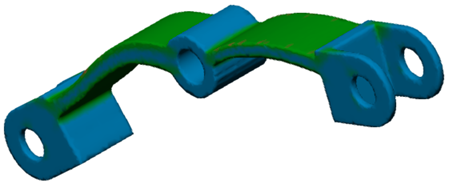
The Stress View command enables you to display a stress distribution map on the outcome. The map is based on the factor of safety set in the Objectives and Limits dialog. The map helps you spot outcome regions that may require your attention.
To access the command, in the Outcome View, click Display > Stress view ![]() .
.

By mousing over the Stress Reference legend, you can view explanations of colors on the map.
Red - regions where the factor of safety is lower than the target specified in the Objectives and Limits dialog.
Green - regions with the most-performant stress.
Blue – regions where stress values are lower than required.

The Stress View of an example outcome.
Note: You need to validate the outcomes, by calculating stress, strain, displacement, and safety factor resulting from the applied loads. To do it, you can create and solve a simulation Static Stress study from a generative setup.