Iteration trend
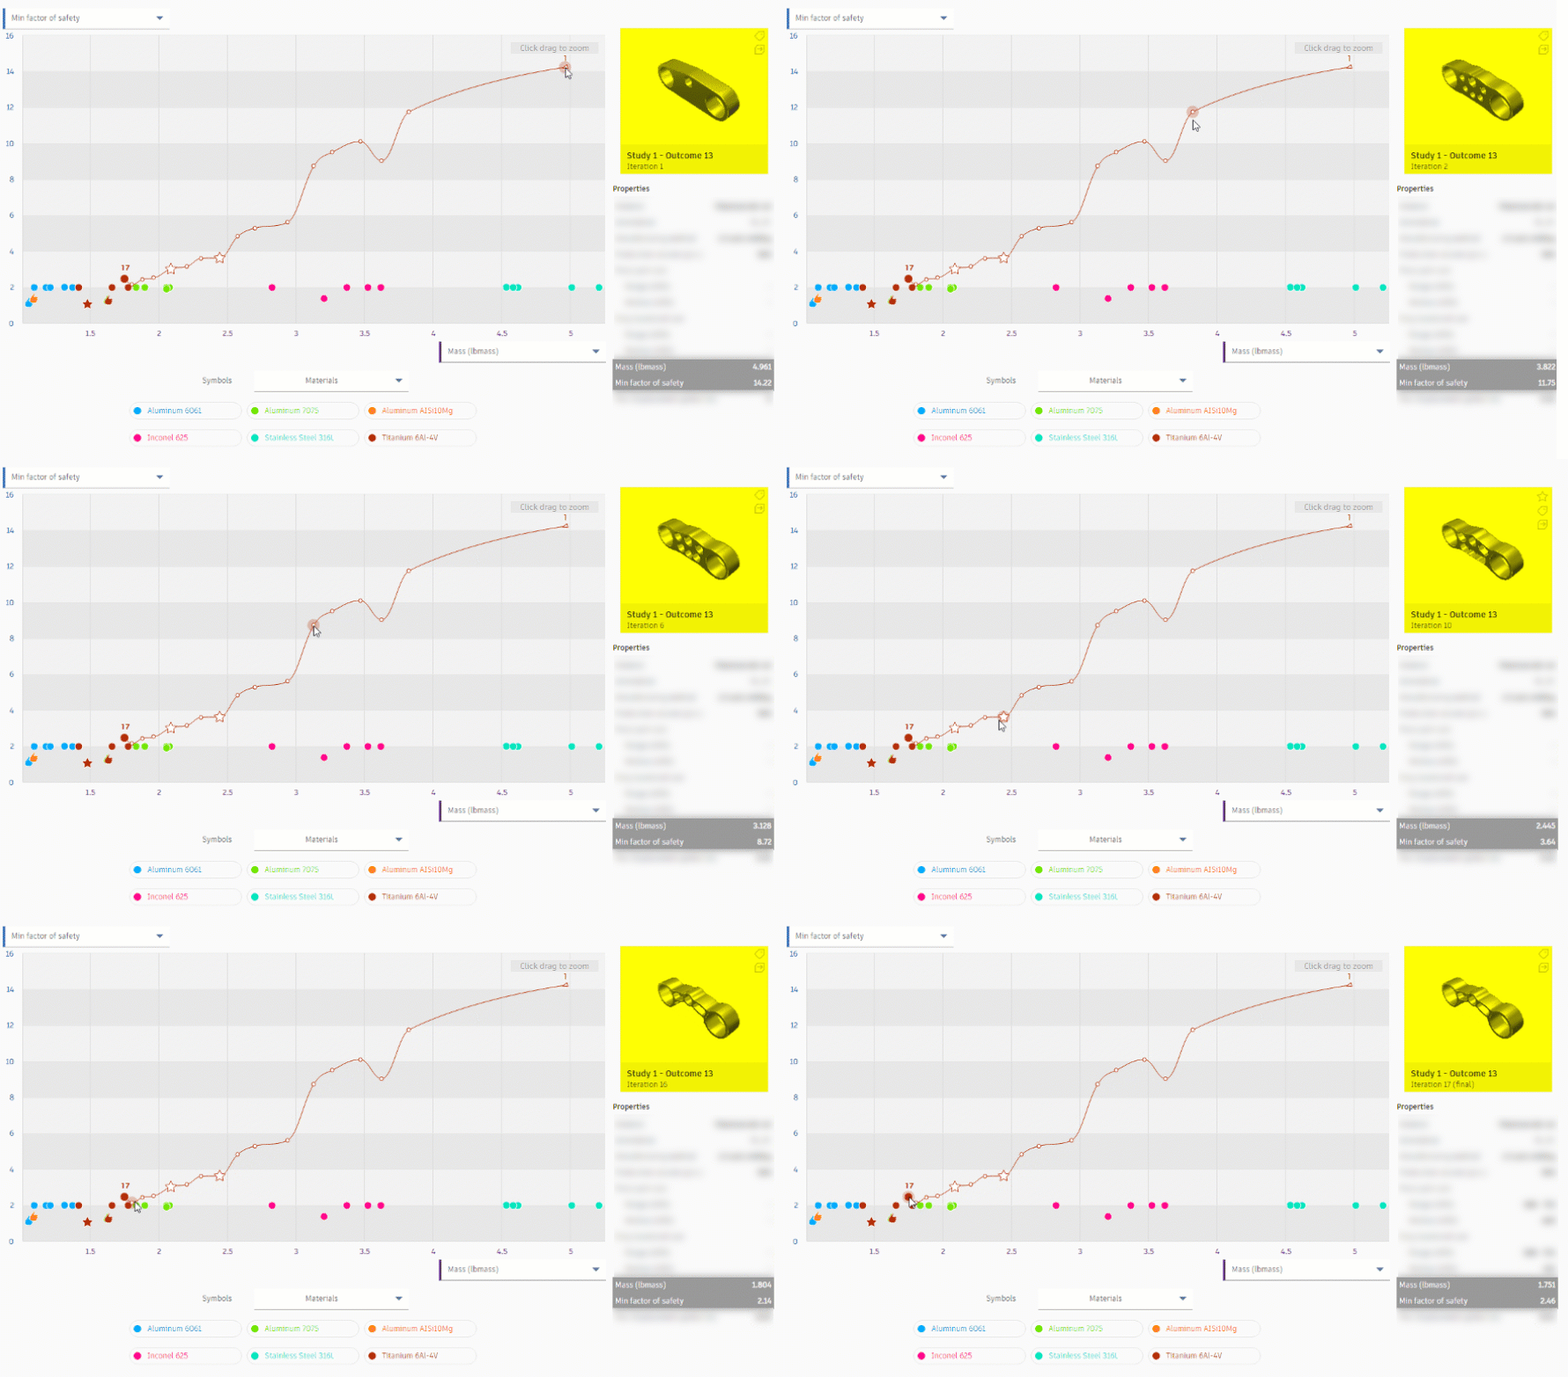
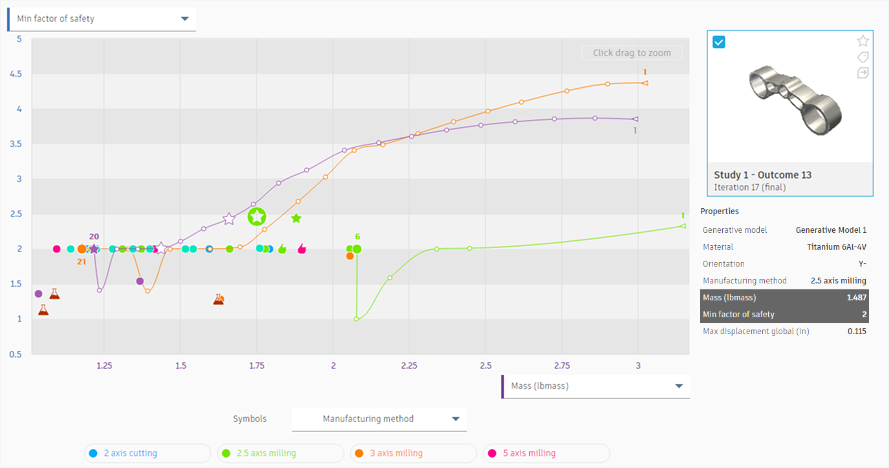
Iteration trend displays the optimization process of an outcome in the Scatter Plot View.
To access the option, click a marker in the scatter plot and then on the outcome card, click ![]() .
.

The first and final iterations are numbered on the trend. The first iteration, from which the iteration trend begins, is marked with an arrow.
You can display one or more iteration trends at the same time.

To show the iteration trend for an outcome
In the Scatter Plot View, click an outcome.
On the outcome card, click
 .Tip: Alternatively, you can press CTRL and click a marker.
To hide the iteration trend for an outcome
In the Scatter Plot View, click an outcome.
On the outcome card, click
 .Tip: Alternatively, you can press CTRL and click a marker. To hide all iteration trends press CTRL and click a blank space in the scatter plot.