Scatter Plot View
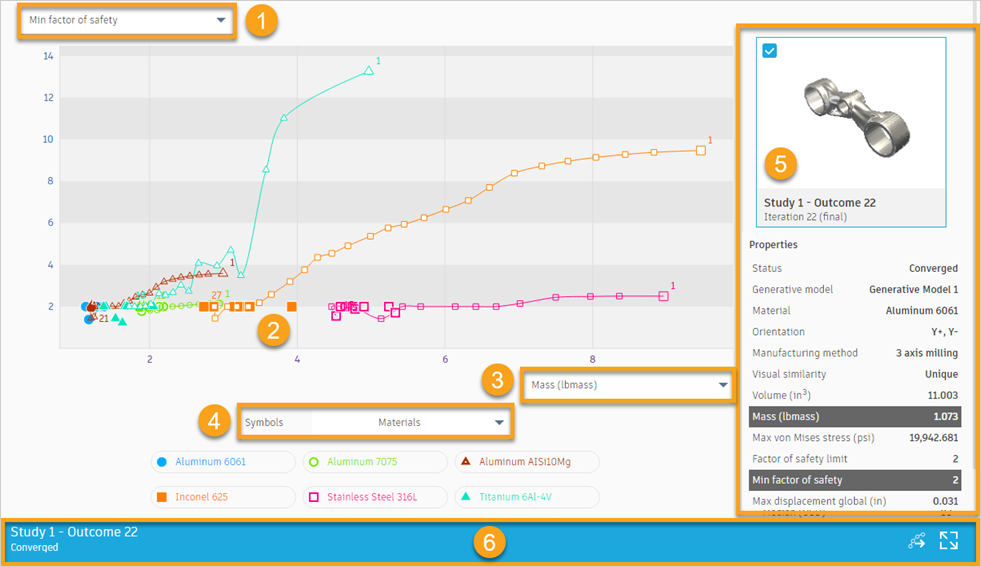
The Scatter Plot View displays a scatter plot of outcomes.
Here, you can select properties and display them on axes to see the outcomes' distribution on the scatter plot. When you select an outcome you can open the iteration trend to see the optimization process of the outcome or open the Outcome View for it. Additionally, you can select multiple outcomes to open them in the Comparison View. You can also export a table of outcomes' data to a CSV file and create a design from an outcome as well.

1. Properties list - vertical axis
Use this properties list to select the properties for which you want to view the performance of outcomes.
You can view the performance of outcomes in terms of volume, mass, maximum displacement, maximum von Mises stress, and minimum factor of safety.
2. Outcomes represented by markers
Each marker on the scatter plot represents an outcome. The markers are coded with different colors and shapes depending on the selected properties. Click the marker to select or deselect an outcome. When you select an outcome, the marker becomes highlighted.
Press Shift and click markers in the scatter plot to select multiple outcomes.
3. Properties list - horizontal axis
Use this properties list to select the properties for which you want to view the performance of outcomes.
You can view the performance of outcomes in terms of volume, mass, maximum displacement, maximum von Mises stress, and minimum factor of safety.
4. Symbols list
Use the Symbols list to map properties to colors and shapes of markers. The properties that you can map include: processing status, materials, and manufacturing method. The color legend lists properties relevant to your project. For example, the image in this topic shows that the colors indicate materials used in the project.
5. Properties pane
Includes a thumbnail and properties of an outcome.
The thumbnail shows a visual representation and identifying information of an outcome. The properties highlighted are those currently chosen in the horizontal and vertical axes. The properties pane shows properties of an outcome represented by a large marker in the scatter plot.
You can customize the properties by using the Visibility settings option.
6. Outcome card
Displays when you select an outcome. From here, you can:
- Open the Outcome View by clicking the
 icon.
icon. - Select three outcomes that are most visually similar to the selected one by clicking the
 icon.
icon. - Display the iteration trend for the selected outcome by clicking the
 icon.
icon. - Hide the iteration trend for the selected outcome by clicking the
 icon.
icon.
When you select multiple outcomes, the outcome card changes into the Multiple selection card and displays the Comparison View icon ![]() . It enables you opening the outcomes in the Comparison View.
. It enables you opening the outcomes in the Comparison View.