Group outcomes by visual similarity
Grouping by visual similarity enables:
Organizing outcomes into groups based on their aesthetics
Quick access to similar outcomes
Finding related outcomes to explore.
This way, exploring and finding the optimal outcome is easier and faster, particularly in studies with many outcomes.
How grouping by visual similarity works
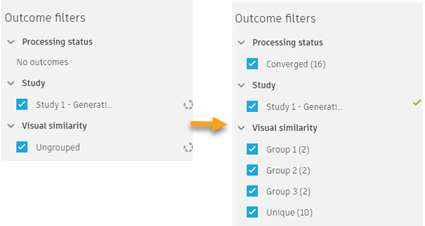
Until the generation is in progress, you see only one outcome group in the Outcome filters pane under Visual similarity. It is called Ungrouped.
Grouping starts after generation processes for all studies are completed. When it's finished, you can see groups of visually similar outcomes in the Outcome filters pane. Outcomes that don't match any group are in the Unique group.

Outcomes are grouped based on their final iterations. But if you add intermediate iterations to favorites, they will also be grouped.
When you sort outcomes by visual similarity in the Thumbnail View and Properties View, they are color-coded based on groups. The color-coding persists in the Scatter Plot View.
If you run another generation, outcome groups disappear from the Outcome filters pane. They are displayed again after the generation is completed.
Finding the most similar outcomes
This tool enables you to find and select three outcomes that are most visually similar to the selected one. To do it:
Select an outcome.
Click
 on the outcome card.
You can also do it by clicking an outcome while pressing the Alt key.
It is available in the Thumbnail View, Properties View, Scatter Plot View, and Table View.

Next, you can compare the selected outcomes in the Comparison View.
Additional tips
| Quick Tip: Tagging and Filtering for Organization in Generative Design |