Quasi-static curves with the same rate of displacement
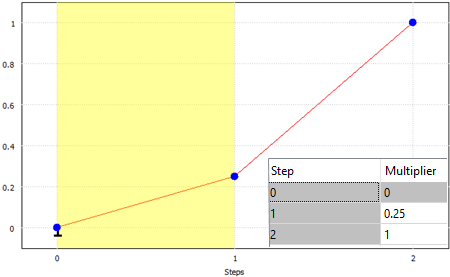
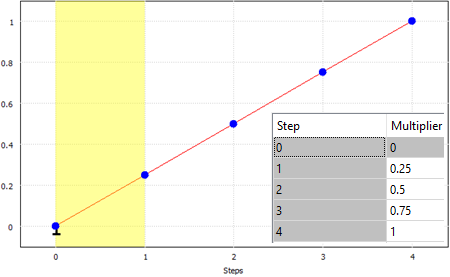
At a glance, the two curves shown in Figure 1 appear to define different rates of displacement. However, when used in concert in the same study, the curves define the same rate of displacement.
Note: The curves shown in this example are used to demonstrate the point. In reality, this prescribed displacement should be defined in a single step, to minimize analysis time and file size.
 |
 |
| Figure 1(a) 2-step multiplier curve. In actuality, the 2nd step is elongated to match 1(b) | Figure 1(b) 4-step multiplier curve. This curve controls the shape of the curve in 1(a) |
In figure 1, both curves prescribe a 0.25 multiplier when moving from 0 to step 1. In step 2, the curve in Figure 1(a) defines a transition from the 0.25 multiplier to the full displacement in a linear manner. Meanwhile Figure 1(b) also defines a linear transition from the 0.25 multiplier to the full displacement, but uses additional steps. The result is that both curves prescribe the same displacement.
 |
Figure 2 Curves with different steps, defining the same rate of displacement.