View Simulation results - legacy viewer
Prerequisites: You have run a Shape optimization, Nonlinear static stress, or Event simulation study and have results to view.
- In the Simulation workspace, on the Setup tab, click
 (Results panel > Simulation Results) to open the Results tab.
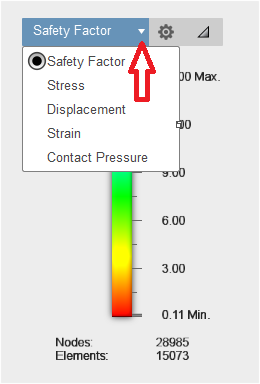
 - Use the Results selector by the legend to select and switch between the different results.
The graphics region updates to display the selected results type.
Transient results
Nonlinear simulations, such as Nonlinear static stress and Event simulation, produce results that change incrementally. Multiple sets of each result are output for a user-specified number of steps. Therefore, an extra item appears near the contour plot legend, specifically, a Step selector:
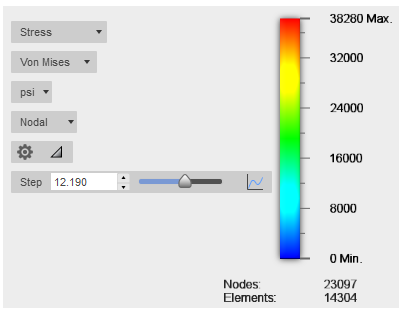
You can click and drag the Step slider to choose any point throughout the simulation event. The results are interpolated between actual solver output steps. You can also type a floating point step number into the provided input field.
To easily step through the actual calculation output steps (integer values), click the up-arrow or down-arrow button to the right of the Step input field:
