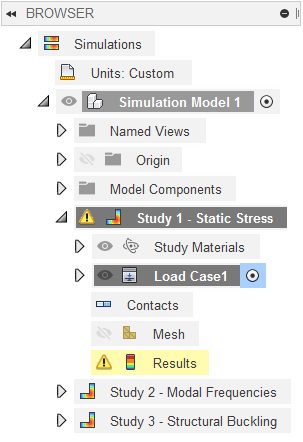
Simulation results
The output of a finite element analysis (FEA) solver is generally a substantial quantity of raw data. This data is difficult and tedious to interpret without graphical representations. Contour plots are graphical displays that represent the distribution of stresses, deformation, temperature, and other results, using various colors. A key aspect of a simulation analysis is the proper interpretation and evaluation of these results.
The results evaluation phase is where the most critical thinking takes place. Compare the color contours and numerical results with what you expect to see. Determine if the results make sense and explain the results based on sound engineering principles. If the results are different from what you expect, evaluate the model setup and determine what is causing the discrepancy.
For some studies the results are viewed downloaded, while for others they are streamed from a browser-based online viewer. The tools for analysing the results are slightly different in each case.
| Studies using standard results viewer | Studies using online results viewer |
|---|---|
| Static stress | Electronics cooling |
| Modal frequencies | Injection molding simulation |
| Structural buckling | |
| Thermal | |
| Thermal stress | |
| Shape optimization | |
| Nonlinear static stress | |
| Event simulation |
