Shape optimization analysis results
When the Shape Optimization study is complete, you can see the newly generated reference shape.
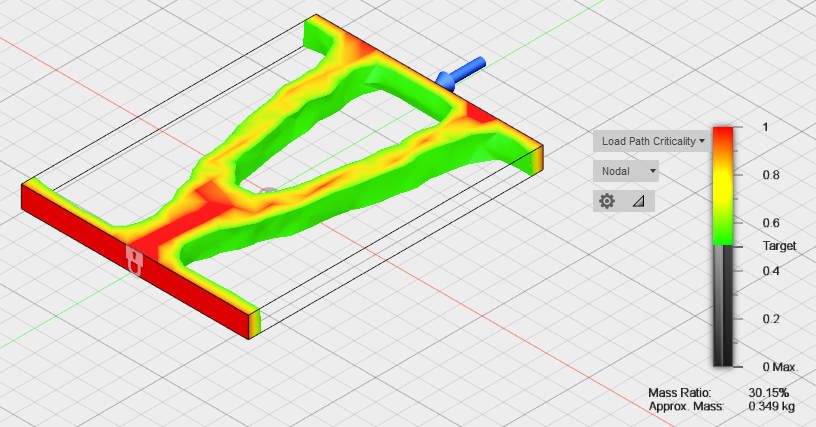
Additionally, the results show the Load Path Criticality, the Mass Ratio, and the Approximate Mass.
The Mass Ratio indicates the percentage of the original mass that remains. When the results are first displayed, the Mass Ratio should approach the Target Mass percentage specified in the Shape Optimization Criteria.
The Approximate Mass represents the mass of the remaining geometry.